Fig. 5.
Download original image
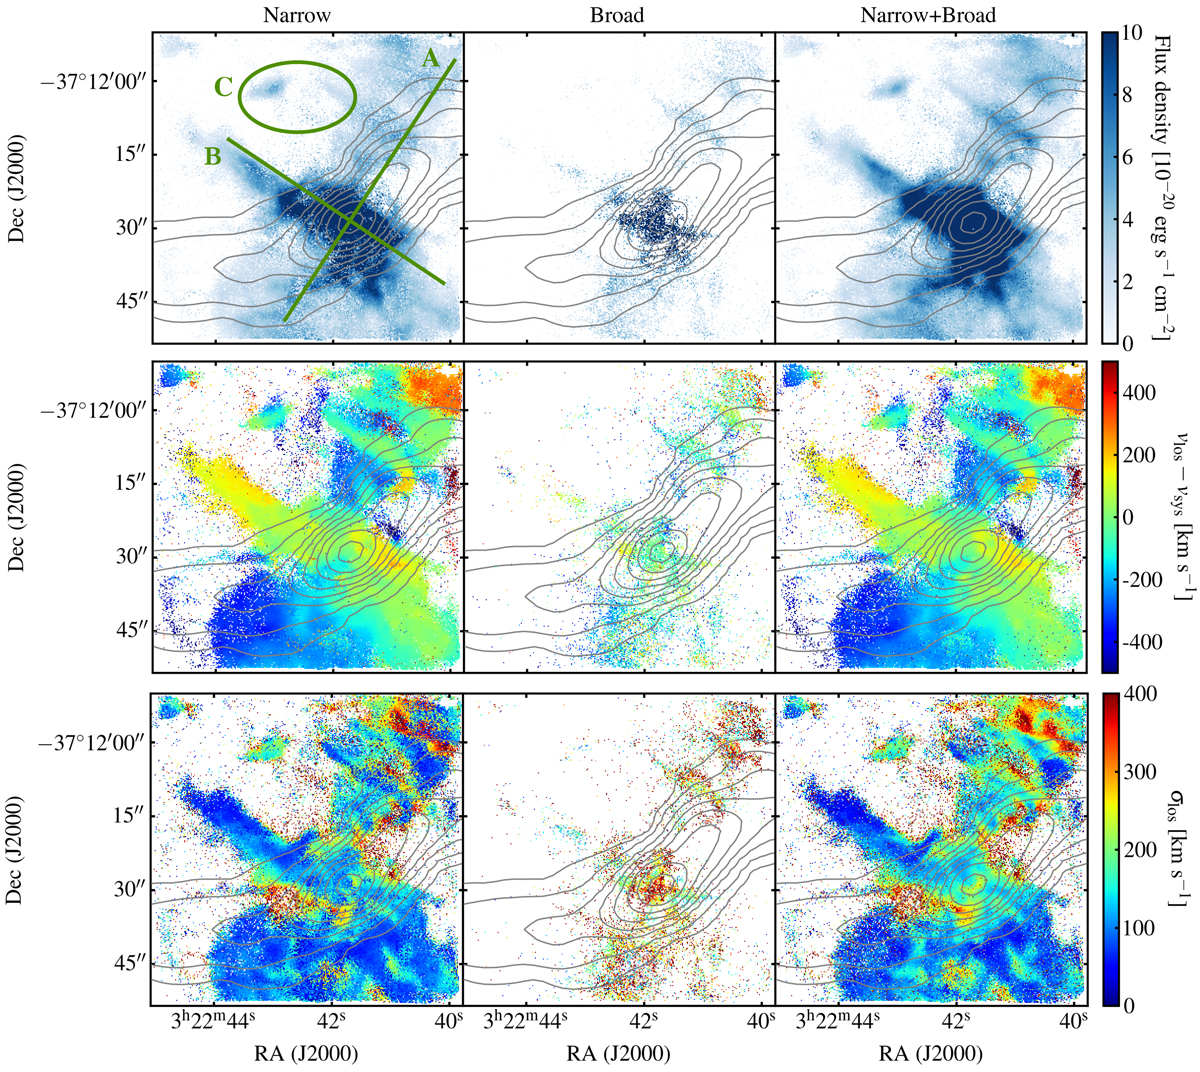
Flux density distribution (top row), velocity field (central row), and velocity dispersion maps (bottom row) of the ionised gas. Left, middle, and right columns: distribution of the narrow Gaussian component, of the broad Gaussian component, and of the integrated fitted line (narrow+broad components), respectively. The radio jets of Fornax A are overlaid in grey in all panels. See Sect. 5 for details on the regions identified in the top left panel.
Current usage metrics show cumulative count of Article Views (full-text article views including HTML views, PDF and ePub downloads, according to the available data) and Abstracts Views on Vision4Press platform.
Data correspond to usage on the plateform after 2015. The current usage metrics is available 48-96 hours after online publication and is updated daily on week days.
Initial download of the metrics may take a while.