Free Access
Fig. B.1.
Download original image
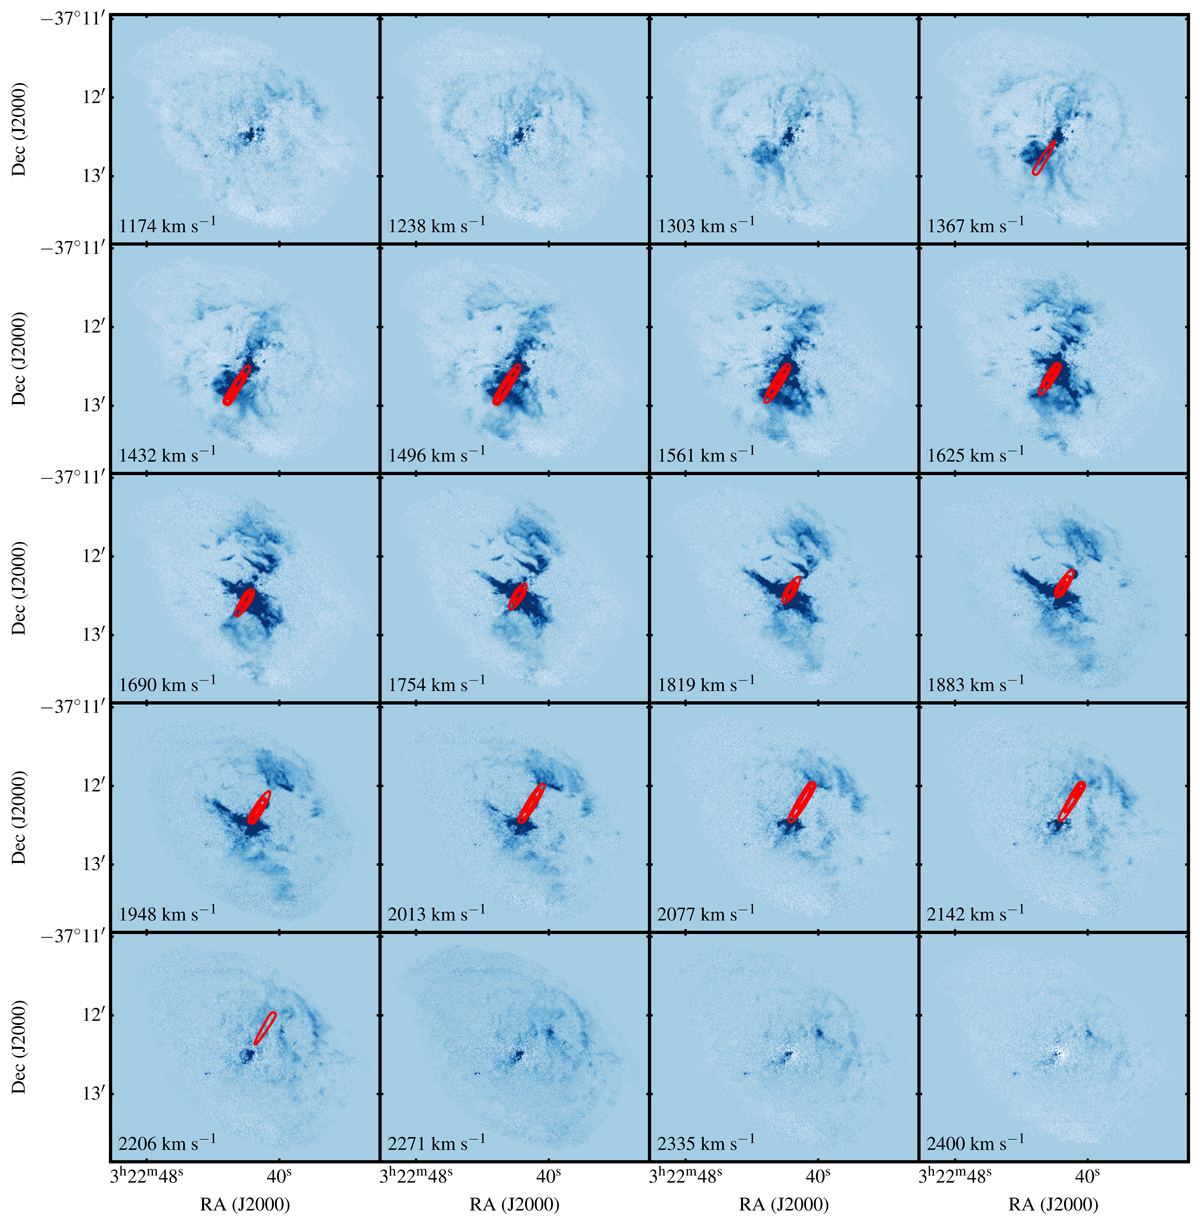
Consecutive channel maps extracted from the MUSE wide-field datacube. Overlaid in red are the contours of the tilted ring model that best reproduces the [N II]λ6583 emission (as well as the CO and H I seen at lower resolution). We refer the reader to Sect. 6.1 for further details.
Current usage metrics show cumulative count of Article Views (full-text article views including HTML views, PDF and ePub downloads, according to the available data) and Abstracts Views on Vision4Press platform.
Data correspond to usage on the plateform after 2015. The current usage metrics is available 48-96 hours after online publication and is updated daily on week days.
Initial download of the metrics may take a while.