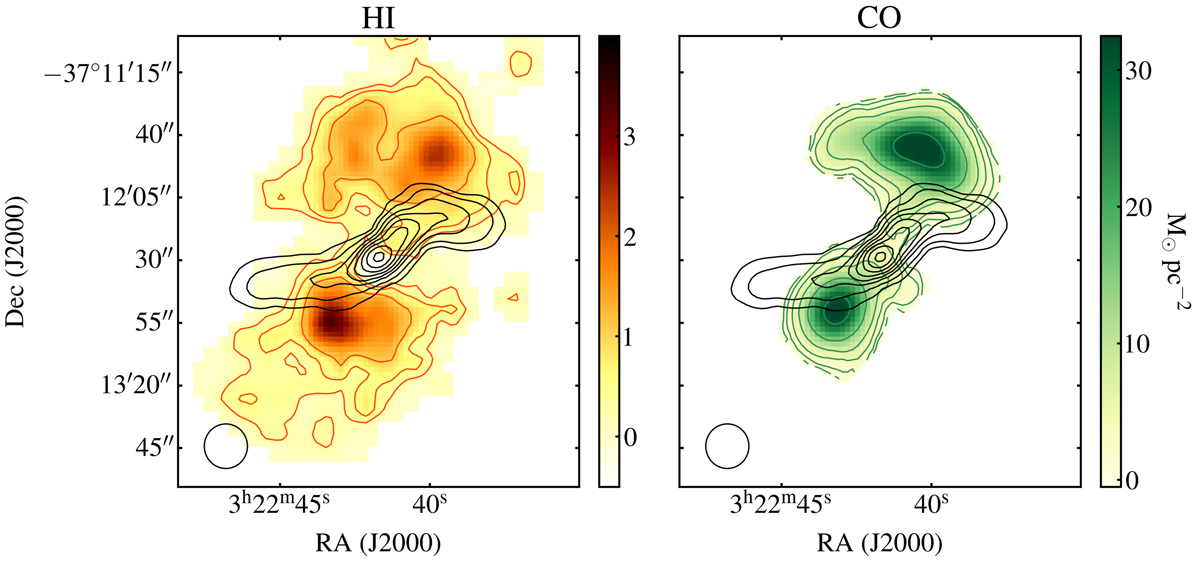
Fig. 2.
Download original image
Left panel: surface brightness map of the H I gas in the centre of Fornax A. Right panel: same maps for the 12CO(1−0). The PSF of all maps is at 22″ × 18″. Surface brightness contour levels are 3σ × 2n M⊙ pc−2 (n = 0, 1, 2, …) in all panels. The lowest contour corresponds to the 3σ surface brightness detection limit. Radio jets are the same as in Fig. 1.
Current usage metrics show cumulative count of Article Views (full-text article views including HTML views, PDF and ePub downloads, according to the available data) and Abstracts Views on Vision4Press platform.
Data correspond to usage on the plateform after 2015. The current usage metrics is available 48-96 hours after online publication and is updated daily on week days.
Initial download of the metrics may take a while.