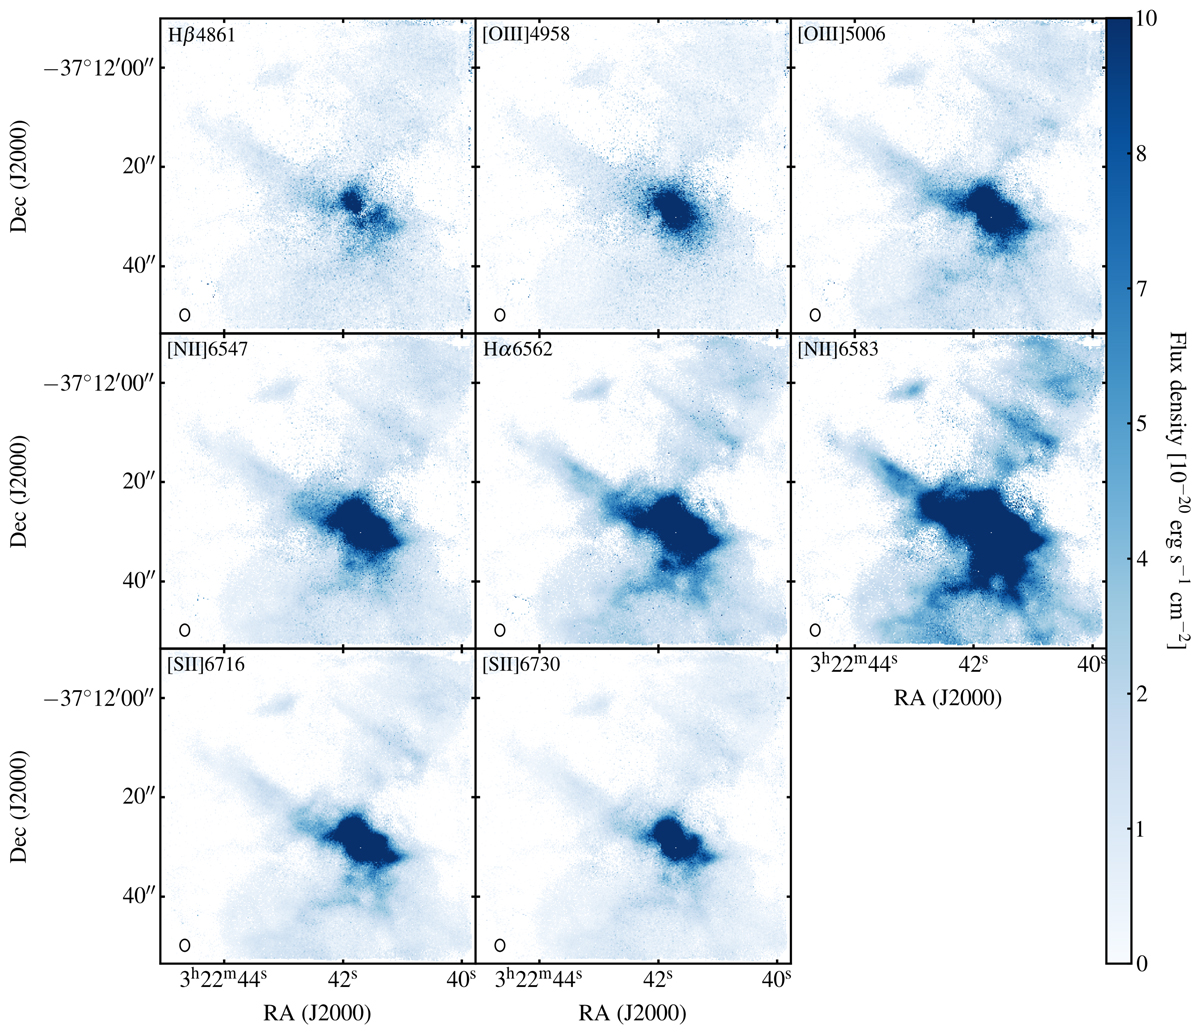
Fig. A.5.
Download original image
Total flux density distribution of the fitted lines, on the same colour scale. In all lines, the filamentary structure of the NS disk and EW stripe can be appreciated. The highest emission is found in the centre and along the EW streams. The PSF of the MUSE observations (2″) is shown in the bottom left corner of each panel. Near the SE corner, the gaseous supernova remnant studied by López-Cobá et al. (2020) is visible in the in some ionised lines. The study of this, and other SNe remnants was the main science goal of the centre-field MUSE observations.
Current usage metrics show cumulative count of Article Views (full-text article views including HTML views, PDF and ePub downloads, according to the available data) and Abstracts Views on Vision4Press platform.
Data correspond to usage on the plateform after 2015. The current usage metrics is available 48-96 hours after online publication and is updated daily on week days.
Initial download of the metrics may take a while.