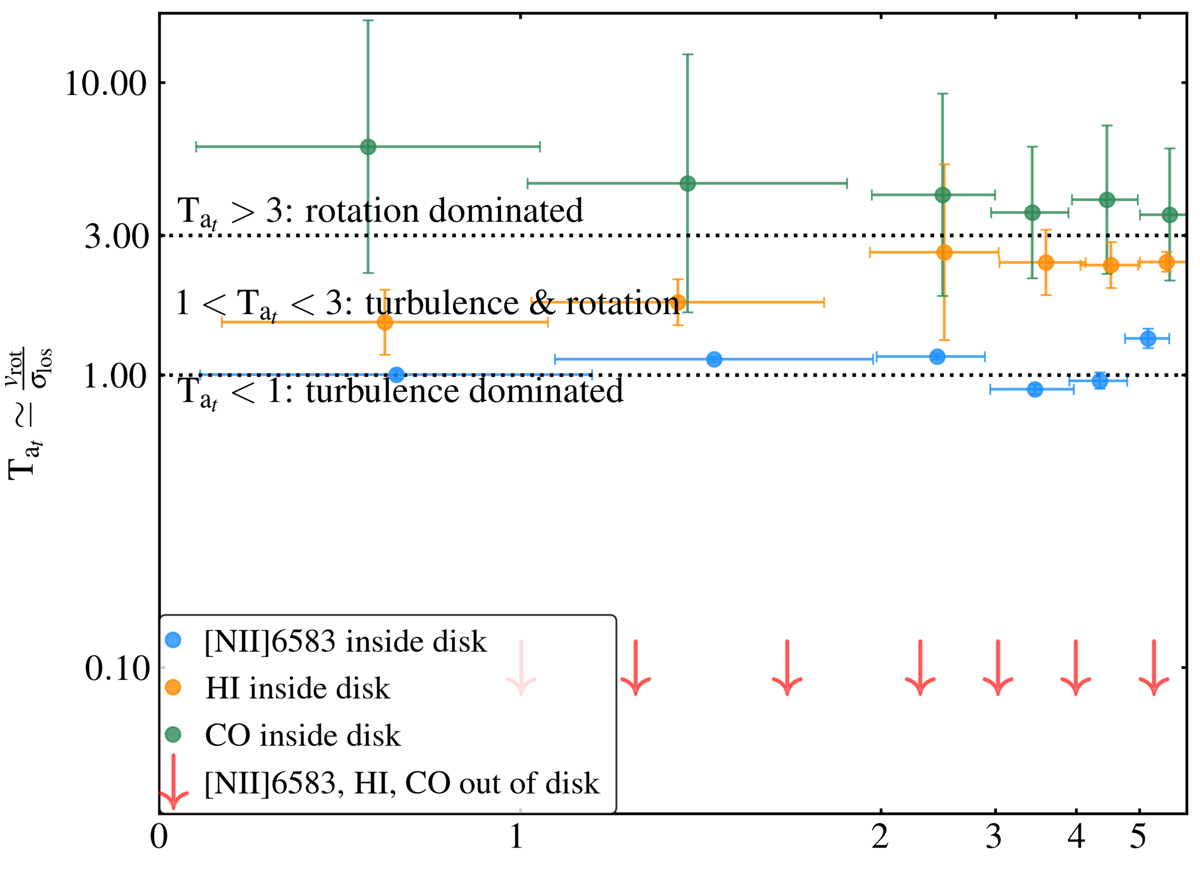
Fig. 11.
Download original image
Radial profile of the Taylor number (Tat = vrot/σlos; Gaspari et al. 2015, 2017), in logarithmic scale. In green, orange, and blue, we show three phases of the gas within the rotating disk, in red the upper limits to Tat of the EW-stripe and filaments outside the disk, which are mostly dominated by pure turbulence. We label the areas of rough transition from rotation- to turbulence-dominated (‘CCA-driven’) kinematics, with dotted lines as separators.
Current usage metrics show cumulative count of Article Views (full-text article views including HTML views, PDF and ePub downloads, according to the available data) and Abstracts Views on Vision4Press platform.
Data correspond to usage on the plateform after 2015. The current usage metrics is available 48-96 hours after online publication and is updated daily on week days.
Initial download of the metrics may take a while.