Fig. 10.
Download original image
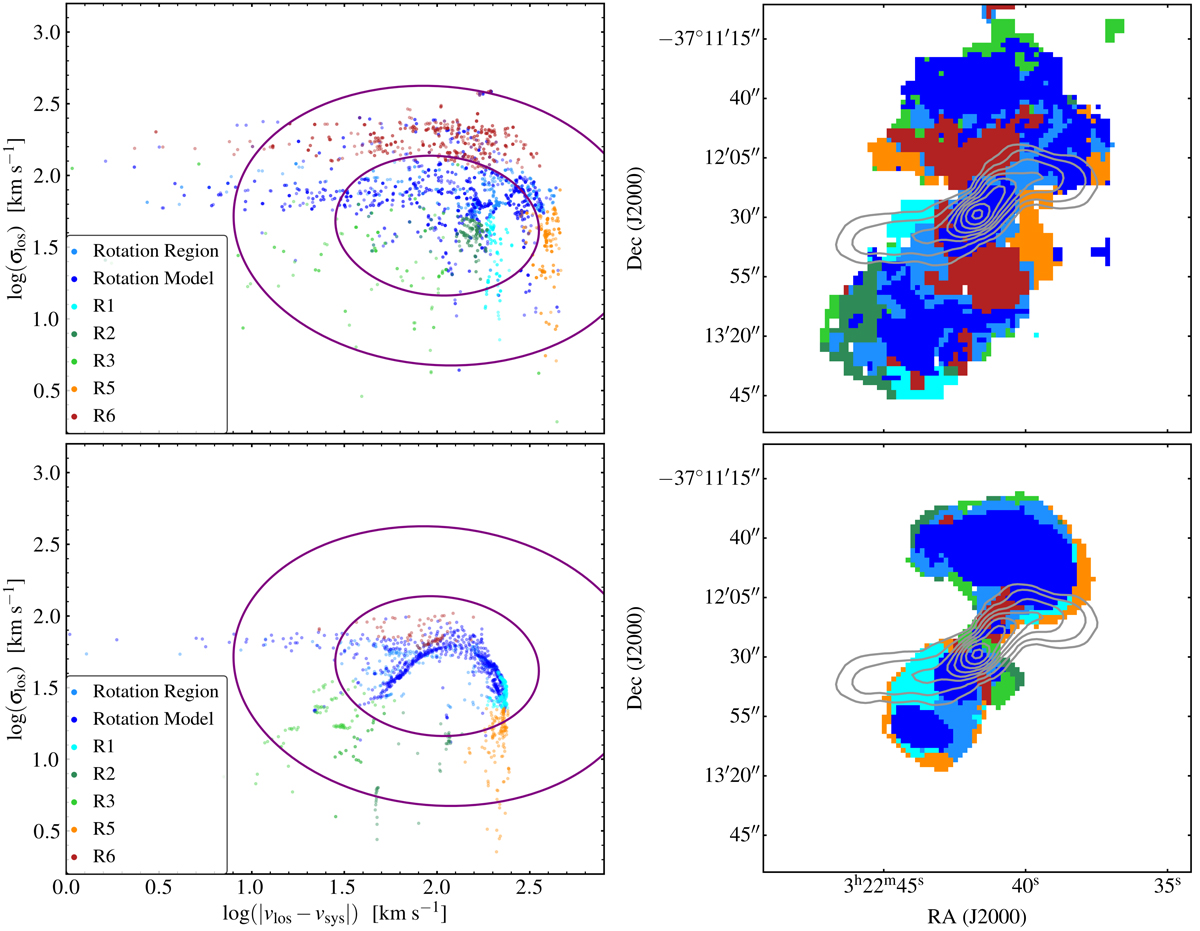
Left panels: velocity dispersion versus line shift with respect to the systemic velocity of the H I and CO, respectively, in logarithmic scale. Colours identify different regions in the plot. Pixels consistent with the model of rotation are shown in blue, while pixels in the kinematical region of rotation are shown in light blue. The purple ellipses are the same as in the left panel of Fig. 9. Right panels: distribution of the H I and CO, respectively. Colours correspond to the plot in the left panel. Radio jets are shown in grey. The H I and CO different loci, in particular R6 and the rotating regions, are distributed similarly to the ionised gas regions, but on a larger scale.
Current usage metrics show cumulative count of Article Views (full-text article views including HTML views, PDF and ePub downloads, according to the available data) and Abstracts Views on Vision4Press platform.
Data correspond to usage on the plateform after 2015. The current usage metrics is available 48-96 hours after online publication and is updated daily on week days.
Initial download of the metrics may take a while.