Fig. 4.
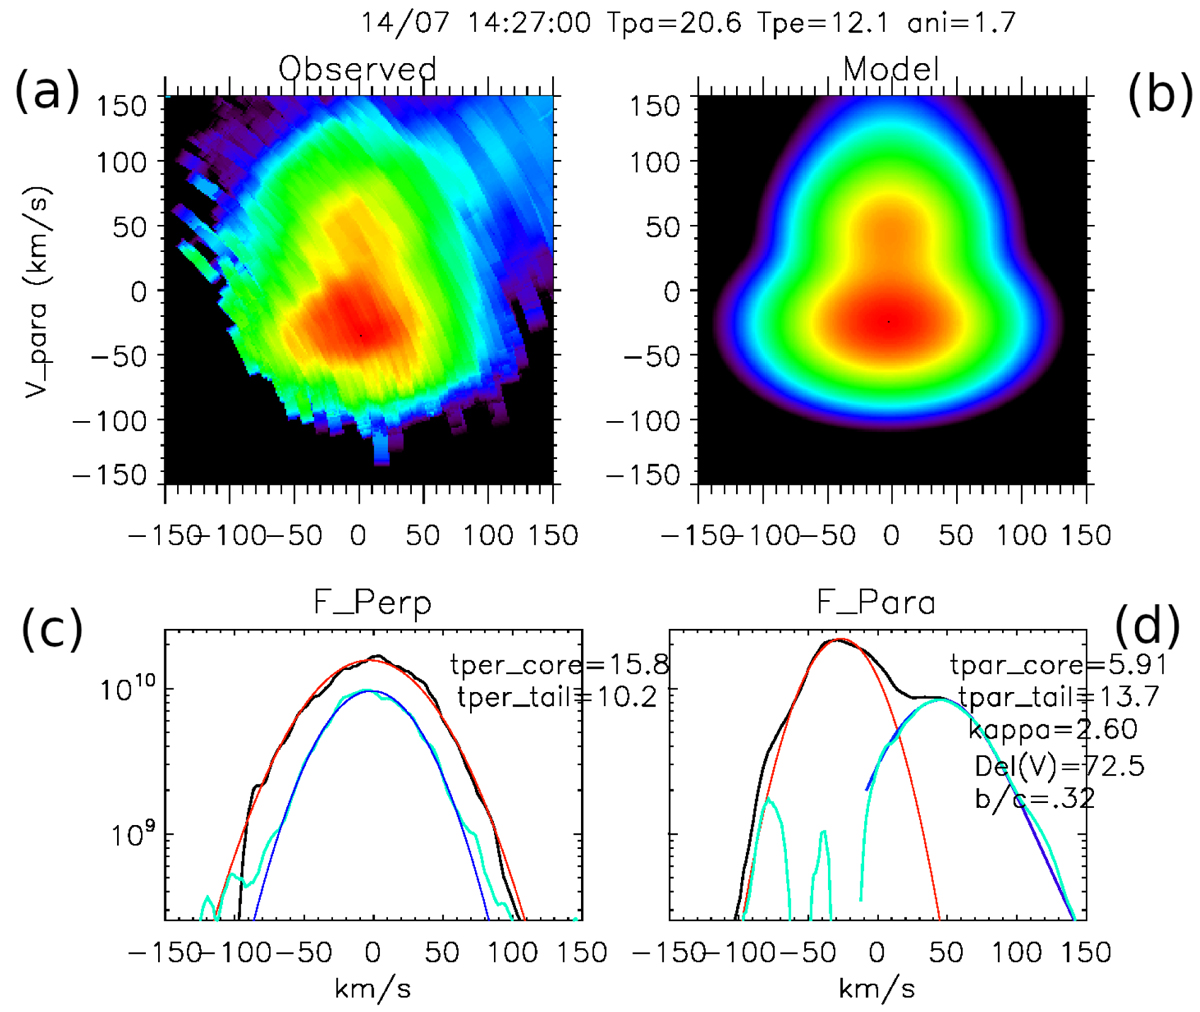
Download original image
Typical VDF and its model. Panel a: slice of the measured VDF in a plane containing B, with parallel and perpendicular axis centered on the solar wind velocity. Panel b: reconstructed VDF. Panels c, d: plots of the distribution along the perpendicular and the parallel axis. The initial distribution is in black, the core bi-Maxwellian in red, the remaining population (initial minus core) in green, and the beam model in blue. The VDF unit is s3 m−6. The maximal VDF value is 2.5 1010.
Current usage metrics show cumulative count of Article Views (full-text article views including HTML views, PDF and ePub downloads, according to the available data) and Abstracts Views on Vision4Press platform.
Data correspond to usage on the plateform after 2015. The current usage metrics is available 48-96 hours after online publication and is updated daily on week days.
Initial download of the metrics may take a while.