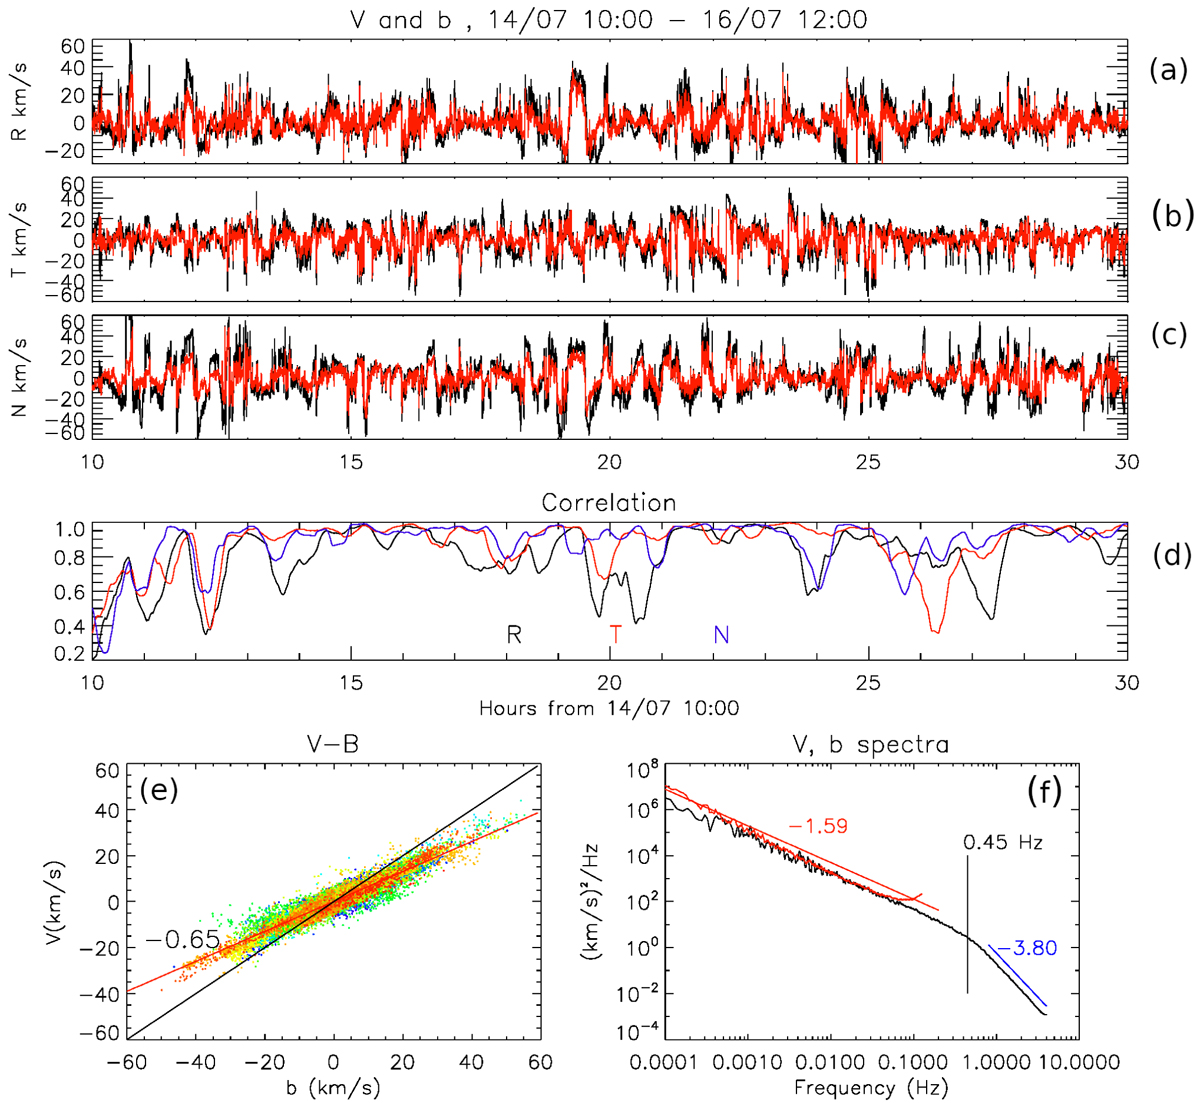
Fig. 2.
Download original image
V − b correlation. Panels a–c: RTN components of b = B/(μ0ρ)1/2 (in black) and of proton velocity (in red). To better show the correlation, −b is plotted. The averaged value of VR, computed over a 1 h sliding window, is removed in (a). Panel d: cross-correlation of R (black), T (red) and N (blue), calculated on ten-minute sliding windows; panel e: scatter plots of bT and VT, the color (from blue to red) indicates the time; panel f: power spectra of b (black) and V (red) fluctuations.
Current usage metrics show cumulative count of Article Views (full-text article views including HTML views, PDF and ePub downloads, according to the available data) and Abstracts Views on Vision4Press platform.
Data correspond to usage on the plateform after 2015. The current usage metrics is available 48-96 hours after online publication and is updated daily on week days.
Initial download of the metrics may take a while.