Open Access
Fig. 1.
Download original image
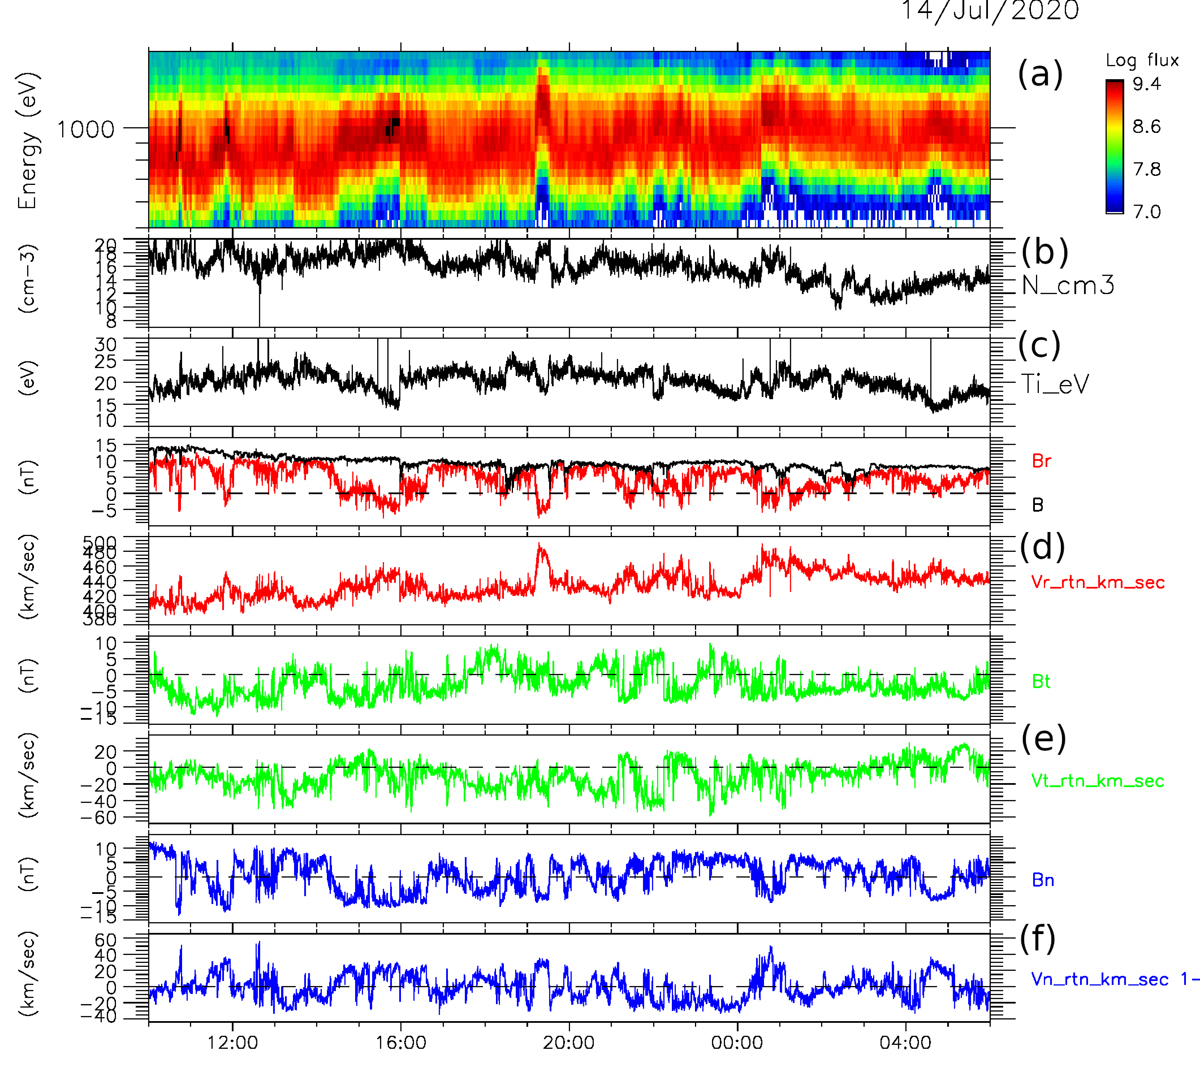
PAS and MAG observations from 14/07 10:00 to 15/07 6:00. From top to bottom: (a) Time/energy spectrogram of ion flux, from 500 eV to 1.7 keV (unit: part. s−1 cm−2 sr−1 keV−1); (b and c): proton density and temperature; (d–f): magnetic and velocity field components in RTN frame. In (d), |B| (in black) is also presented.
Current usage metrics show cumulative count of Article Views (full-text article views including HTML views, PDF and ePub downloads, according to the available data) and Abstracts Views on Vision4Press platform.
Data correspond to usage on the plateform after 2015. The current usage metrics is available 48-96 hours after online publication and is updated daily on week days.
Initial download of the metrics may take a while.