Fig. 9.
Download original image
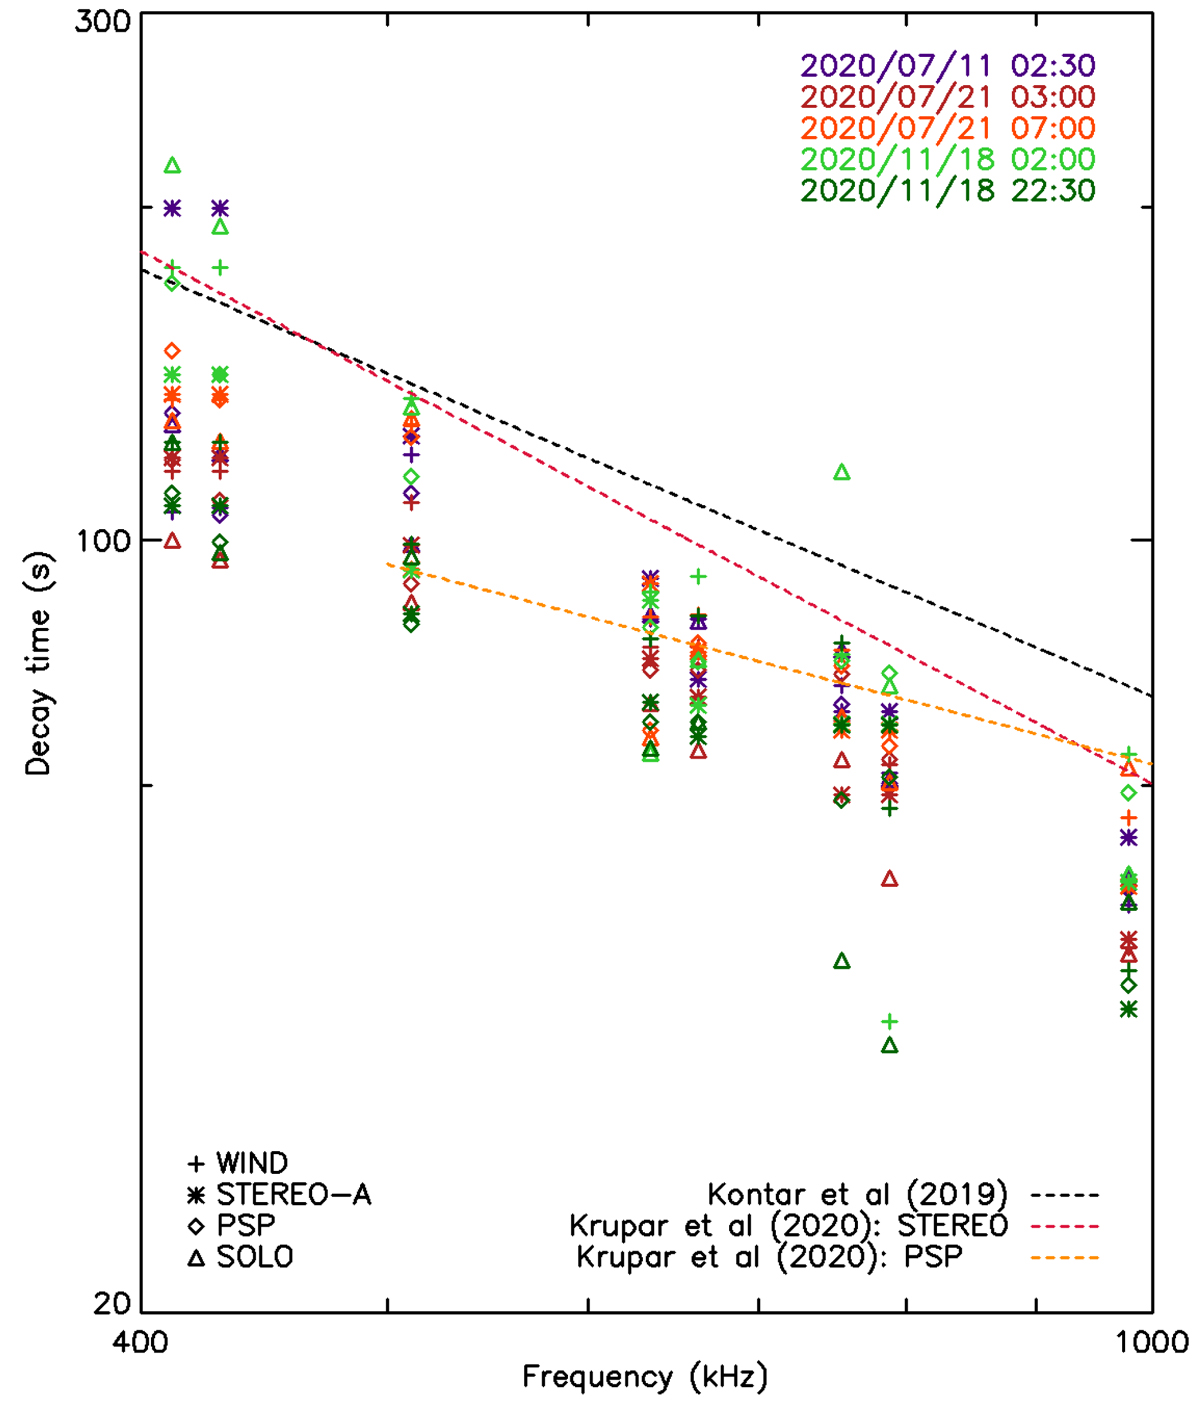
Decay times of the radio bursts presented as a function of the frequency of the radio emission. Different colours show different type III bursts and different symbols show the different probes. The dashed black line show the result of the fit to the data performed by Kontar et al. (2019) on several data sets. The dashed red and orange lines show the result of the fit on the distribution of decay times from 30 radio bursts observed by STEREO and Parker Solar Probe, respectively (Krupar et al. 2020)
Current usage metrics show cumulative count of Article Views (full-text article views including HTML views, PDF and ePub downloads, according to the available data) and Abstracts Views on Vision4Press platform.
Data correspond to usage on the plateform after 2015. The current usage metrics is available 48-96 hours after online publication and is updated daily on week days.
Initial download of the metrics may take a while.