Fig. 8.
Download original image
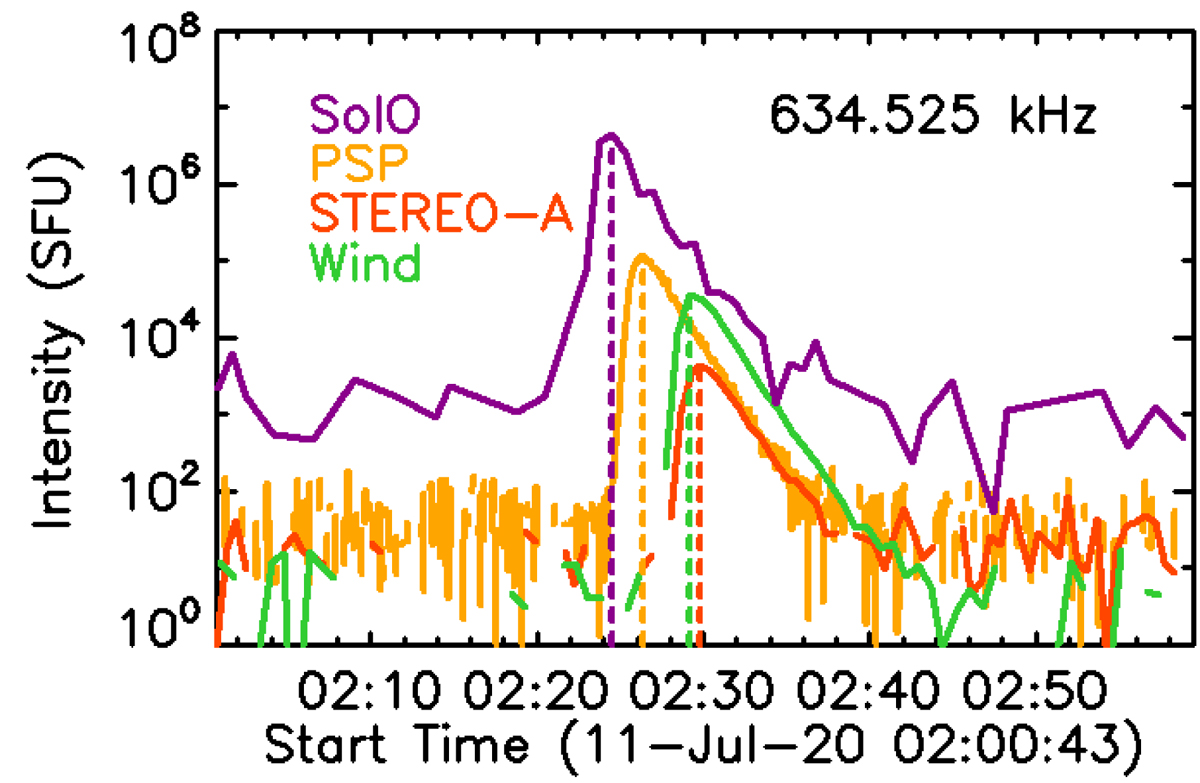
Light curves of the radio fluxes at 634.5 kHz for the event on July 11 2020, observed at Solar Orbiter, Parker Solar Probe, STEREO-A, and Wind. For each of these light curves, the median of the radio signal on an interval of 30 min before 2:20 UT has been removed. For each of the probes, the time of the peak flux is indicated by the vertical dashed lines.
Current usage metrics show cumulative count of Article Views (full-text article views including HTML views, PDF and ePub downloads, according to the available data) and Abstracts Views on Vision4Press platform.
Data correspond to usage on the plateform after 2015. The current usage metrics is available 48-96 hours after online publication and is updated daily on week days.
Initial download of the metrics may take a while.