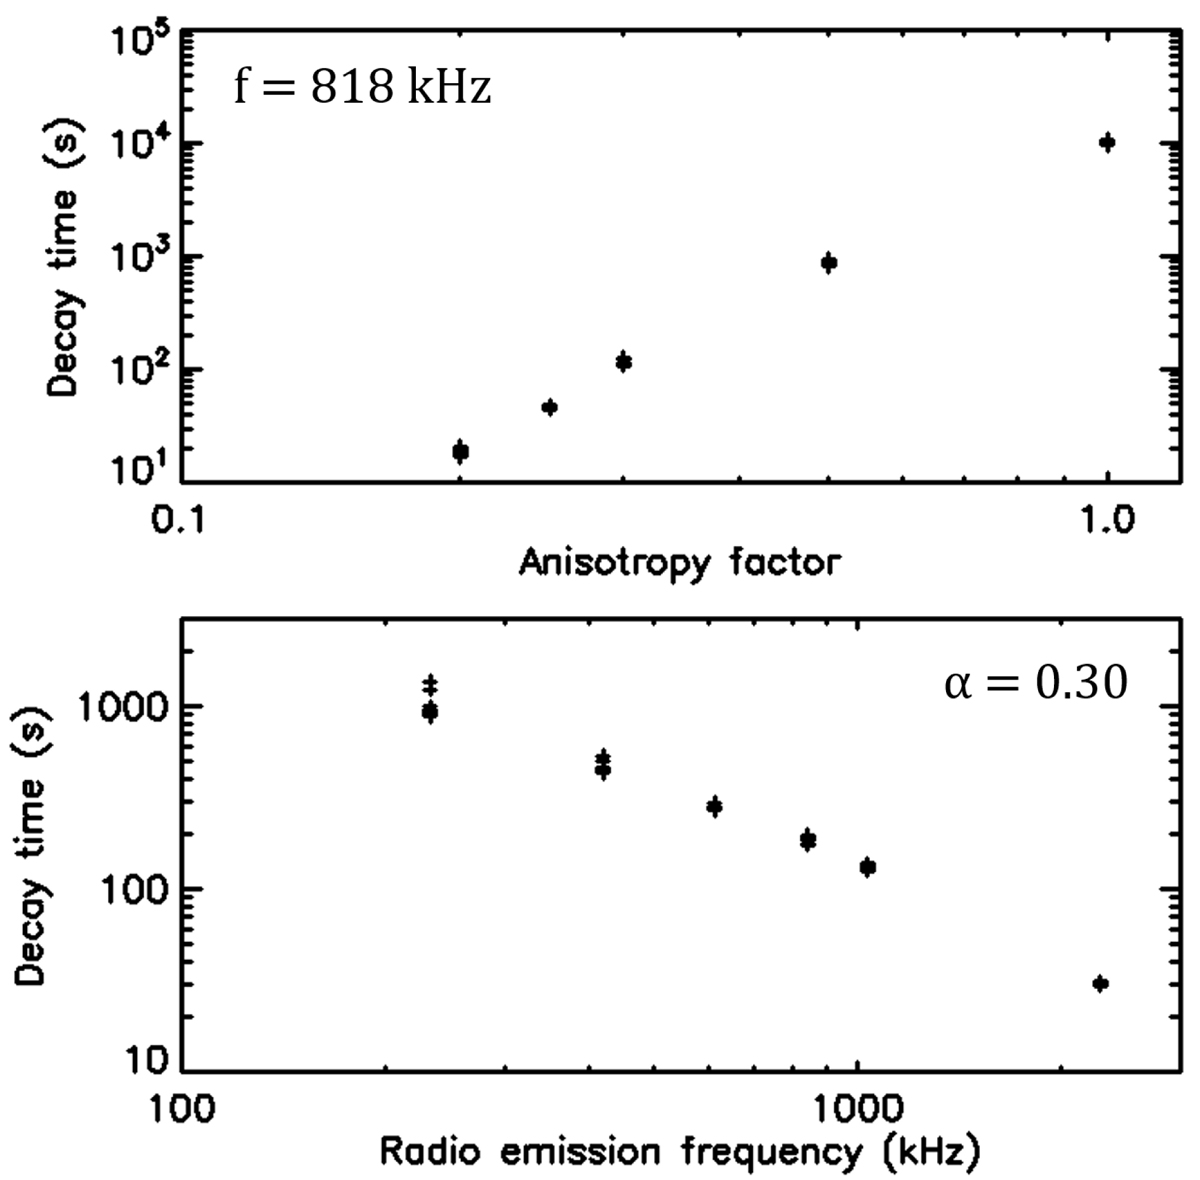
Fig. 5.
Download original image
Evolution of the light curve decay times in the simulations. Top: evolution of the decay time as a function of the anisotropy factor α, for emissions at 818 kHz. Bottom: evolution of the decay time as a function of the radio emission frequency (assuming fundamental emission) for an anisotropy factor of 0.3. On each plot, the decay time is determined at different angles from the radio source.
Current usage metrics show cumulative count of Article Views (full-text article views including HTML views, PDF and ePub downloads, according to the available data) and Abstracts Views on Vision4Press platform.
Data correspond to usage on the plateform after 2015. The current usage metrics is available 48-96 hours after online publication and is updated daily on week days.
Initial download of the metrics may take a while.