Fig. 4.
Download original image
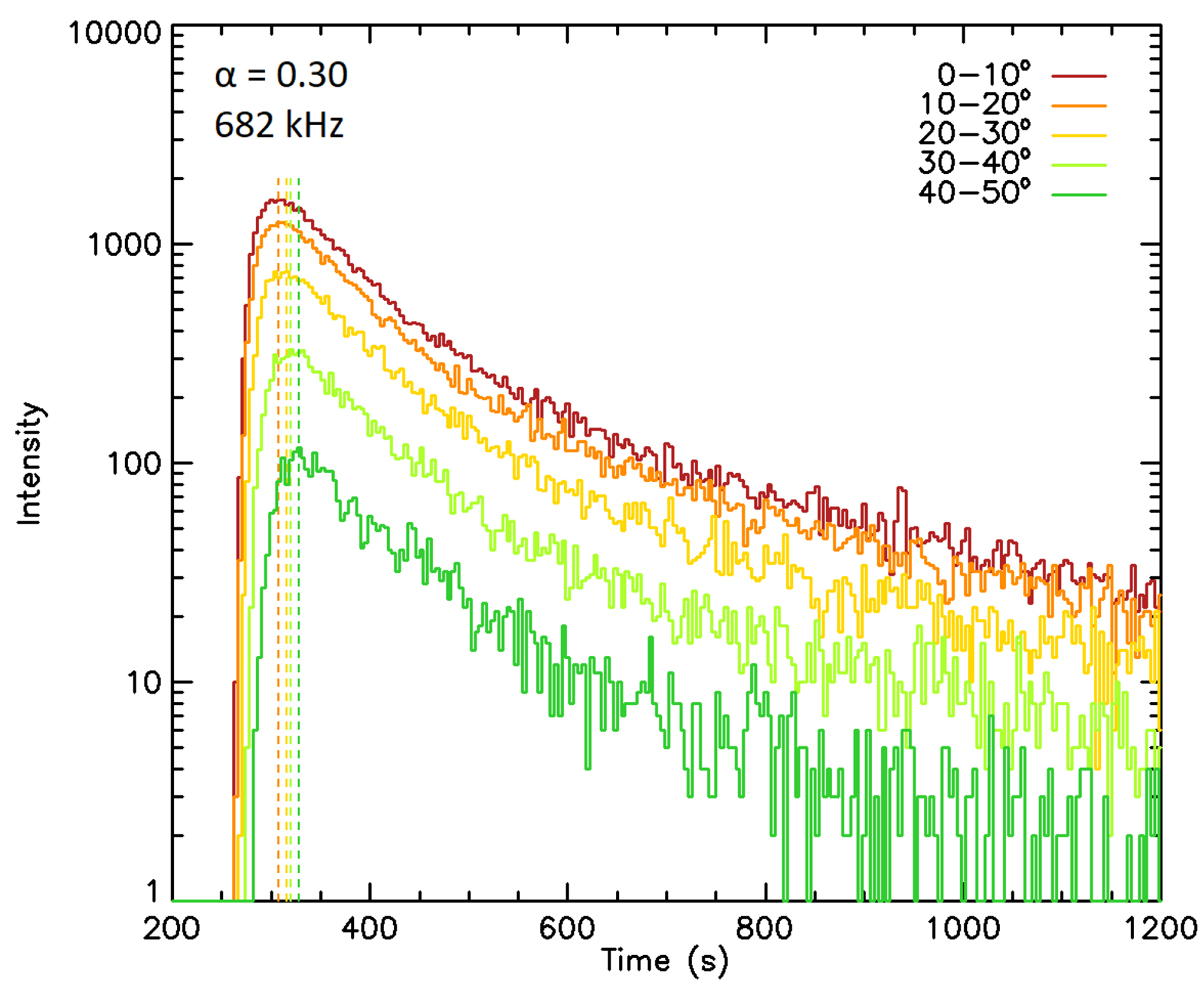
Example of time profiles obtained for photons collected on a sphere of radius 111RS (where propagation effects become negligible), at different angles θP, from the simulations of radio-wave propagation from an emission source at 11RS and an anisotropy factor or α = 0.30. Dashed vertical lines indicate the peak time for each time profile.
Current usage metrics show cumulative count of Article Views (full-text article views including HTML views, PDF and ePub downloads, according to the available data) and Abstracts Views on Vision4Press platform.
Data correspond to usage on the plateform after 2015. The current usage metrics is available 48-96 hours after online publication and is updated daily on week days.
Initial download of the metrics may take a while.