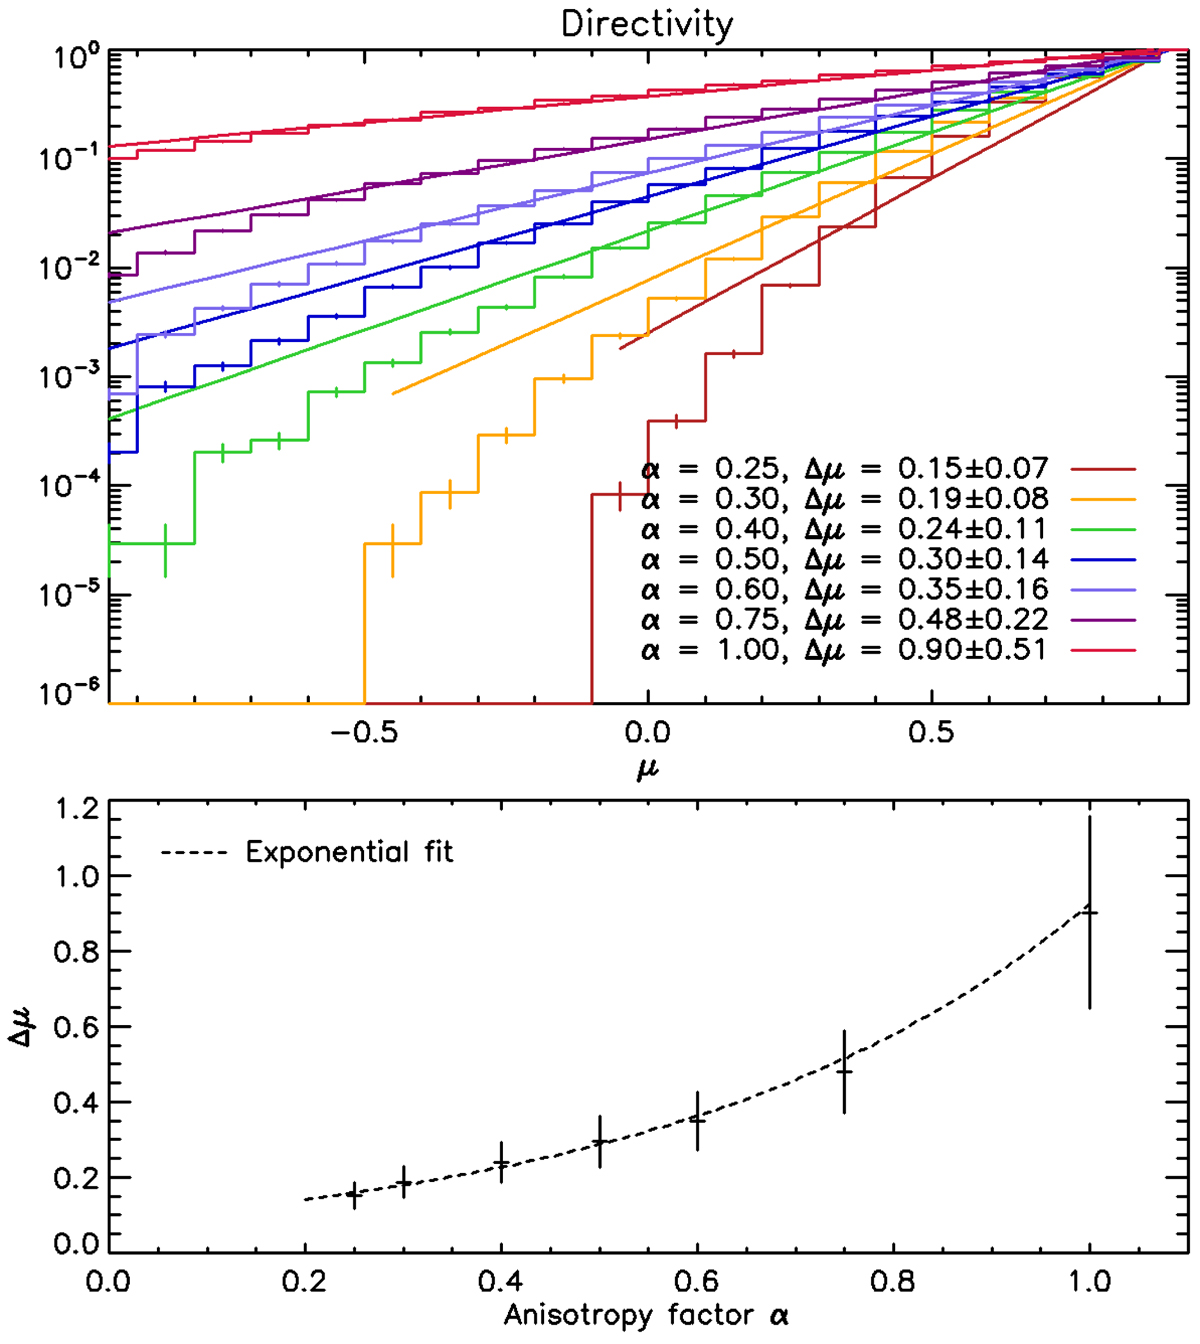
Fig. 2.
Download original image
Effect of the anistropy of density fluctuations on the directivity of the radio emission. Top: normalised directivity as histograms calculated from the results of the simulations (described in Sect. 2.2), with anisotropy factors α = 0.25, 0.30, 0.40, 0.50, 0.60, 0.75, and 1.0. The result of the exponential fit is shown as a line for each curve and the values of the parameter Δμ resulting from this fit are displayed in the low right corner. Bottom: evolution of the parameter Δμ with the anisotropy factor α. The distribution is fitted with an exponential model: Δμ ∝ e(a0α), which gives a0 = 2.2 ± 0.3. The result of this fit is shown as a dashed line.
Current usage metrics show cumulative count of Article Views (full-text article views including HTML views, PDF and ePub downloads, according to the available data) and Abstracts Views on Vision4Press platform.
Data correspond to usage on the plateform after 2015. The current usage metrics is available 48-96 hours after online publication and is updated daily on week days.
Initial download of the metrics may take a while.