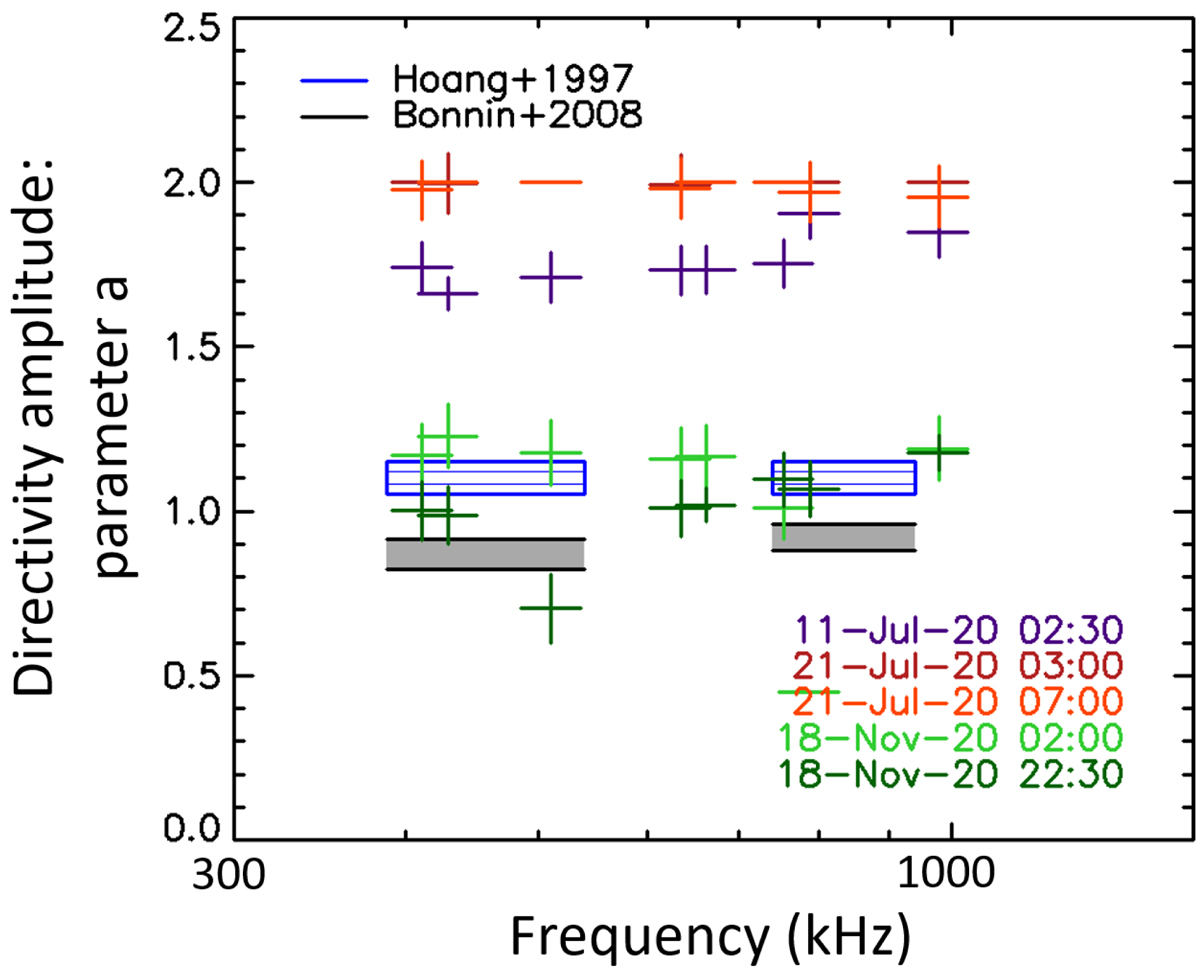
Fig. 13.
Download original image
Parameter a describing the amplitude of the directivity, for the model described by Eq. (5), and determined by a fit of this model to the peak fluxes for the five radio bursts selected, shown as coloured crosses. Previous results obtained in statistical studies of flux ratios of type III radio bursts by Bonnin et al. (2008) and Hoang et al. (1997) are also shown as squared boxes.
Current usage metrics show cumulative count of Article Views (full-text article views including HTML views, PDF and ePub downloads, according to the available data) and Abstracts Views on Vision4Press platform.
Data correspond to usage on the plateform after 2015. The current usage metrics is available 48-96 hours after online publication and is updated daily on week days.
Initial download of the metrics may take a while.