Fig. 11.
Download original image
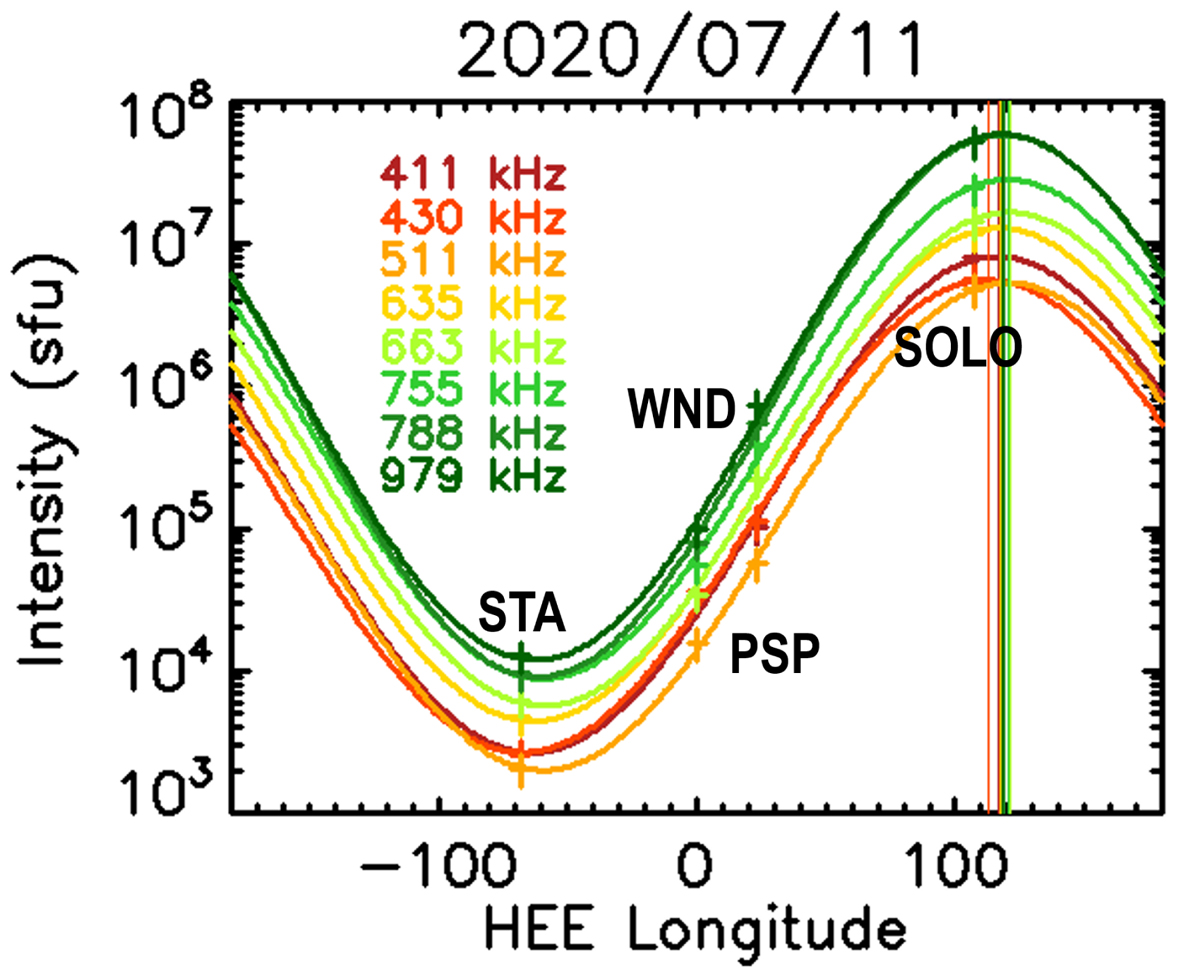
Directivity fit on the peak fluxes measured during the 11 July 2020 event at different frequencies indicated with different colours. STEREO-A, WIND, Parker Solar Probe, and Solar Orbiter measurements are indicated by crosses and labelled as STA, WND, PSP, and SOLO respectively. The vertical lines show the position of the radio source in longitude as determined from the directivity fit.
Current usage metrics show cumulative count of Article Views (full-text article views including HTML views, PDF and ePub downloads, according to the available data) and Abstracts Views on Vision4Press platform.
Data correspond to usage on the plateform after 2015. The current usage metrics is available 48-96 hours after online publication and is updated daily on week days.
Initial download of the metrics may take a while.