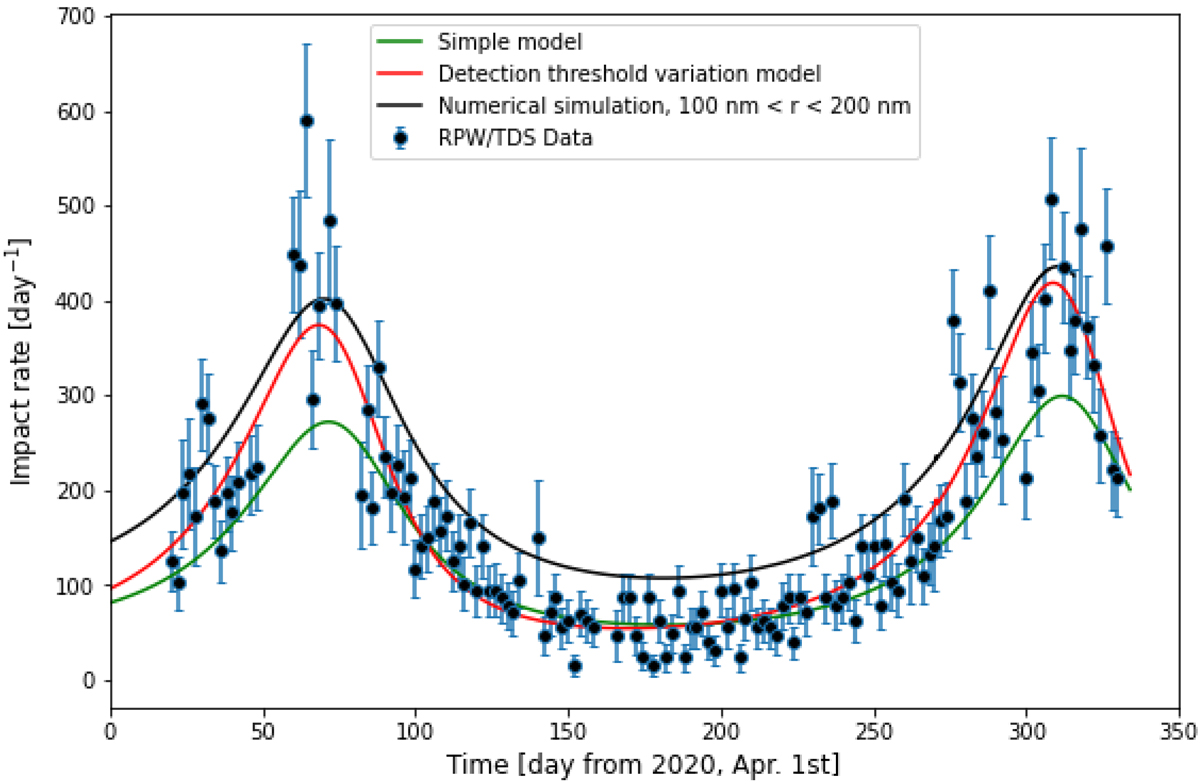
Fig. 8.
Download original image
Dust impact rate onto the spacecraft. Dots show the same data as the one presented in Fig. 3. The green curve shows the expected impact rate for beta meteoroids having a constant outward velocity vβ = 50 km s−1, and a flux density F1 AU = 8 × 10⁻⁵ m−2 s−1 at 1 AU. The red curve shows the flux from Eq. (10) with F1 AU = 8 × 10⁻⁵ m−2 s−1 and αδ = 1.3. The black curve shows the prediction from numerical simulation based on a model of production of dust by collisional fragmentation. The collecting area is assumed to be equal to the heat shield’s surface, Scol = 8 m2.
Current usage metrics show cumulative count of Article Views (full-text article views including HTML views, PDF and ePub downloads, according to the available data) and Abstracts Views on Vision4Press platform.
Data correspond to usage on the plateform after 2015. The current usage metrics is available 48-96 hours after online publication and is updated daily on week days.
Initial download of the metrics may take a while.