Fig. 6.
Download original image
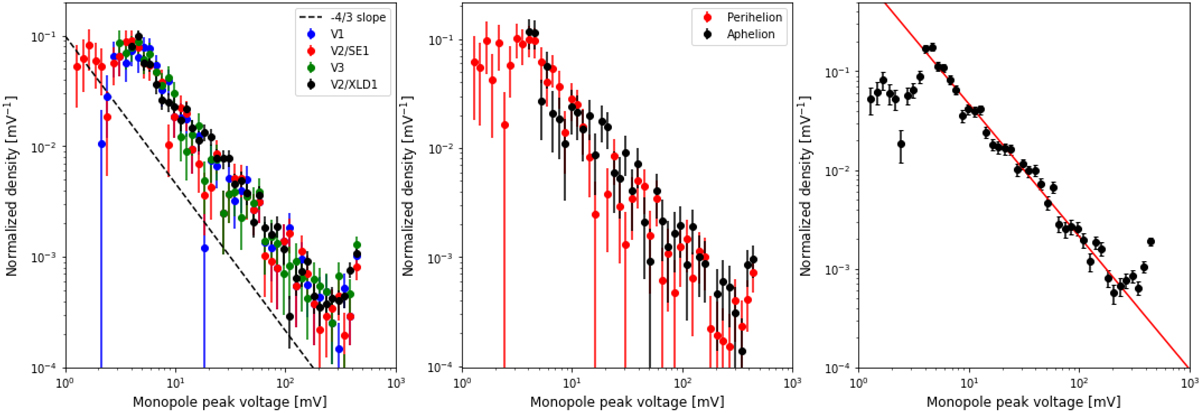
Normalized density (i.e., number of dust detected per unit voltage interval) of voltage peaks in monopole mode. Left panel: distribution of the voltage peaks on all monopoles from April 1 to Nov. 30, 2020. Different colors accounts for different monopoles: V1 (blue), V2/SE1 (red), V3 (green), V2/XLD1 (black). Middle panel: distribution of peak amplitudes on monopole V2 during two different periods (highlighted in green in Fig. 3). Red points correspond to the high impact rate period close to the perihelion (May 13 – June 8), black points to the low impact rate period around the aphelion (Sep 17 – Nov 3). Right panel: result of the least square fitting of all the data recorded on monopole V2 from April 1 to Nov. 30, 2020. The slope of the red curve is −1.34 ± 0.07. In all these figures, error bars are computed from ![]() , where Nbin is the number of counts in the bin, ΔVbin the bin width in mV, and Ntot the total number of events from which the histogram is computed.
, where Nbin is the number of counts in the bin, ΔVbin the bin width in mV, and Ntot the total number of events from which the histogram is computed.
Current usage metrics show cumulative count of Article Views (full-text article views including HTML views, PDF and ePub downloads, according to the available data) and Abstracts Views on Vision4Press platform.
Data correspond to usage on the plateform after 2015. The current usage metrics is available 48-96 hours after online publication and is updated daily on week days.
Initial download of the metrics may take a while.