Fig. 5.
Download original image
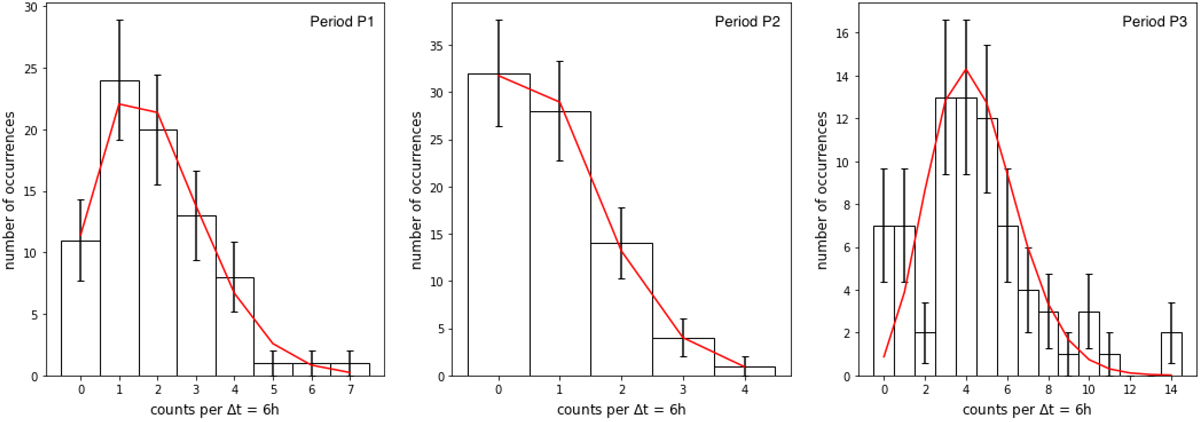
Distribution of number of impacts per time intervals of 6 hours, for three different periods of time corresponding to different mean impact rates. The red curve shows the Poisson distribution calculated from the mean impact rate observed in each of these periods of time. Errorbars on the histograms values are ![]() , with Nbin the number of counts in the histogram bin.
, with Nbin the number of counts in the histogram bin.
Current usage metrics show cumulative count of Article Views (full-text article views including HTML views, PDF and ePub downloads, according to the available data) and Abstracts Views on Vision4Press platform.
Data correspond to usage on the plateform after 2015. The current usage metrics is available 48-96 hours after online publication and is updated daily on week days.
Initial download of the metrics may take a while.