Fig. 4.
Download original image
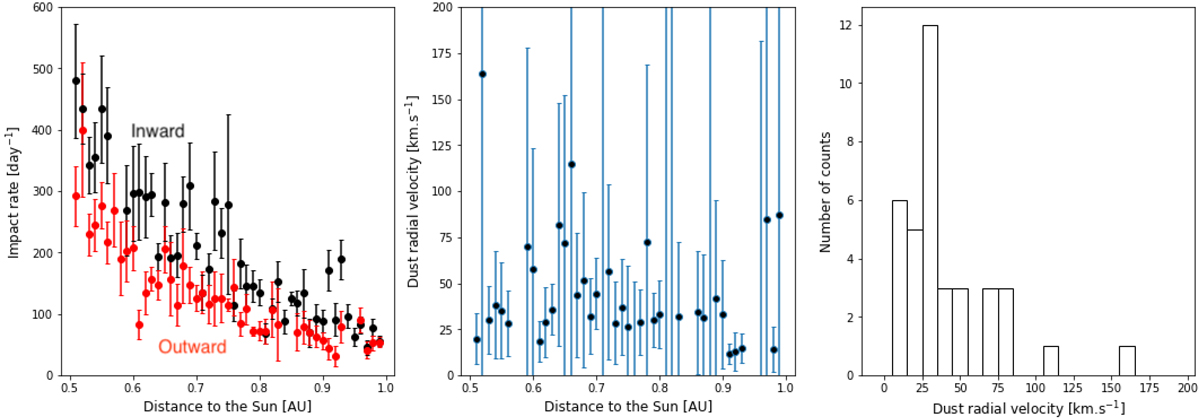
Estimation of the impactors radial velocity from the impact rates. Left panel: impact rate as a function of radial distance. The black points show fluxes recorded when the spacecraft is moving toward the Sun, the red points when moving outward from the Sun. Each point is computed by averaging the impact rate data on 50 distance intervals linearly spaced between 0.5 and 1 AU. Error bars show one standard deviation error on the computation of the mean. Middle panel: radial component of the dust velocity, Vr, dust, computed from Eq. (4). Error bars are computed by propagating errors on the impact rates shown on the left panel. Right panel: histogram of the obtained values of Vr, dust.
Current usage metrics show cumulative count of Article Views (full-text article views including HTML views, PDF and ePub downloads, according to the available data) and Abstracts Views on Vision4Press platform.
Data correspond to usage on the plateform after 2015. The current usage metrics is available 48-96 hours after online publication and is updated daily on week days.
Initial download of the metrics may take a while.