Fig. 3.
Download original image
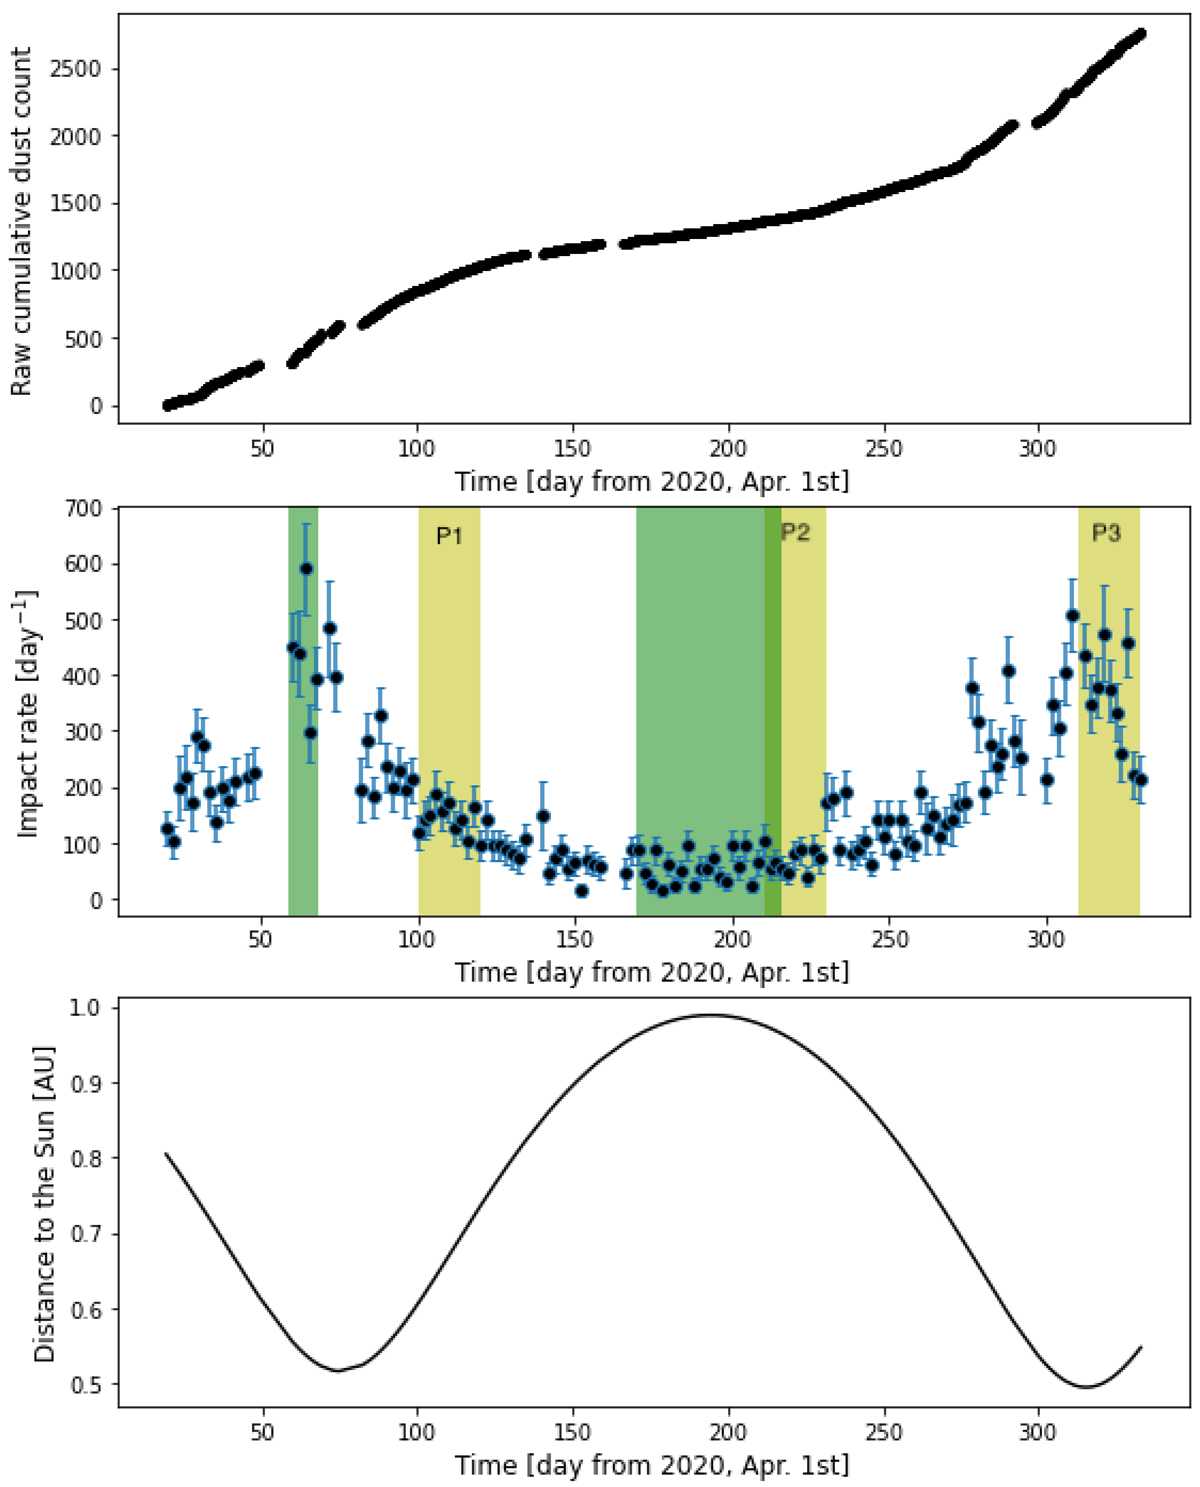
Impact rates recorded by RPW/TDS. Upper panel: raw cumulative dust count as a function of time since April 1, 2020. By raw, it is meant that it is the integer number of impacts provided by the detection algorithm, uncorrected for the instrument’s duty cycle. Middle panel: impact rate as a function of time since April 1, 2020. Each point corresponds to a two-day time interval. The error bars are computed from ![]() , where Δt is the time covered by TDS measurements on the two days considered, and N the number of impacts during these two days. The yellow areas correspond to time periods P1, P2, and P3 on which the number of occurrence distributions of Fig. 5 have been computed. The green areas correspond to times periods on which the amplitude distributions shown on the right panel of Fig. 6 have been computed. Lower panel: distance from the spacecraft to the Sun in astronomical units, as a function of time since April 1, 2020.
, where Δt is the time covered by TDS measurements on the two days considered, and N the number of impacts during these two days. The yellow areas correspond to time periods P1, P2, and P3 on which the number of occurrence distributions of Fig. 5 have been computed. The green areas correspond to times periods on which the amplitude distributions shown on the right panel of Fig. 6 have been computed. Lower panel: distance from the spacecraft to the Sun in astronomical units, as a function of time since April 1, 2020.
Current usage metrics show cumulative count of Article Views (full-text article views including HTML views, PDF and ePub downloads, according to the available data) and Abstracts Views on Vision4Press platform.
Data correspond to usage on the plateform after 2015. The current usage metrics is available 48-96 hours after online publication and is updated daily on week days.
Initial download of the metrics may take a while.