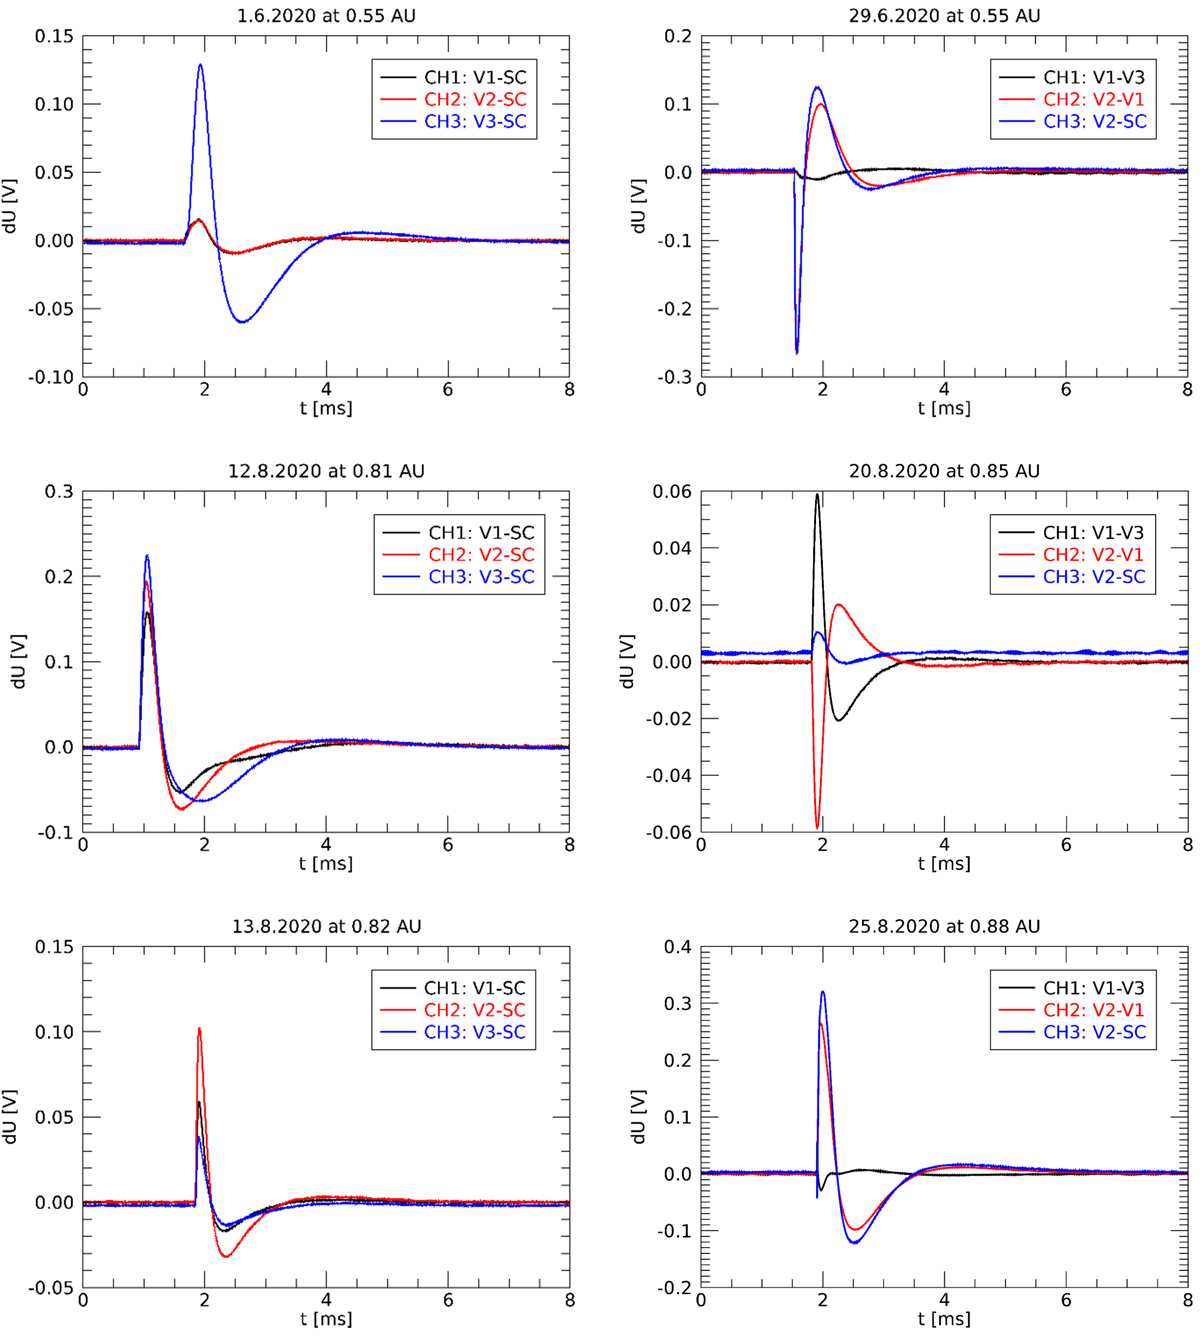
Fig. 1.

Download original image
Six examples of TDS snapshots showing impulsive signals interpreted as due to dust impacts onto the spacecraft. Signals recorded on the three different channels are represented in different colors. The left column shows signals recorded in monopole mode (SE1 mode), whereas the right column shows signals recorded in dipole in the two first channels and monopole in the third one (XLD1 mode).
Current usage metrics show cumulative count of Article Views (full-text article views including HTML views, PDF and ePub downloads, according to the available data) and Abstracts Views on Vision4Press platform.
Data correspond to usage on the plateform after 2015. The current usage metrics is available 48-96 hours after online publication and is updated daily on week days.
Initial download of the metrics may take a while.


