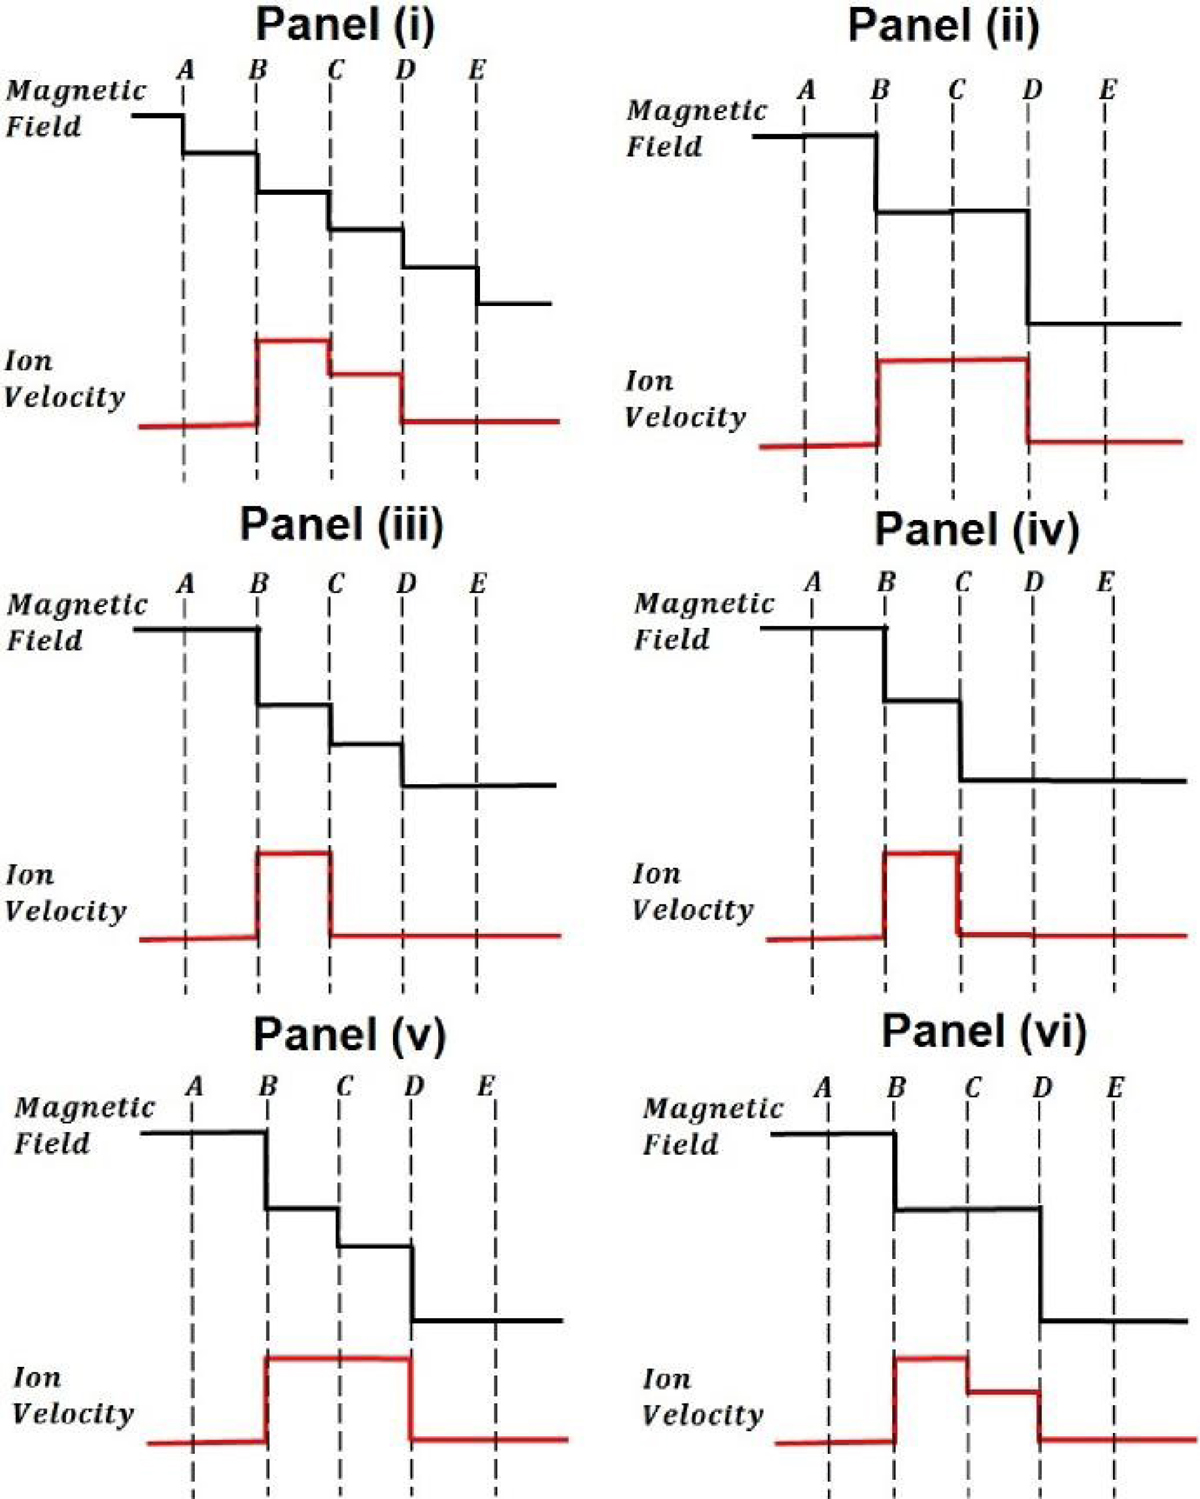
Fig. 2.
Download original image
Representative examples of reconnection outflows and current sheet structure. In each panel, the black trace represents the variation of the transverse component of the magnetic field to the current sheet, while the red trace represents the variation in ion flow velocity. Panel i: result if all possible transitions (current sheets and gradients in ion flows) in the model occur. Panel ii: result which is in keeping with the Gosling model (only rotations at B and C and equal outflows). Panel iii: example where there are rotations are seen at locations B, C, and D but only an outflow between locations B and C is large enough to be detected. Panel iv: similar situation but in this case there is also no detectable field rotation at D. Panel v: situation where there are rotations at B, C, and D but the outflows are similar in strength. Panel vi: example where the magnetic field is the same as in the Gosling model but the outflows vary across the region occupied by the ions. We note that in all cases, the region between A and C has undergone a magnetic topology change and may show variations in the electron population in comparison to the undisturbed regions outside. This is not an exhaustive set, as many variations on these themes are possible.
Current usage metrics show cumulative count of Article Views (full-text article views including HTML views, PDF and ePub downloads, according to the available data) and Abstracts Views on Vision4Press platform.
Data correspond to usage on the plateform after 2015. The current usage metrics is available 48-96 hours after online publication and is updated daily on week days.
Initial download of the metrics may take a while.