Fig. 7.
Download original image
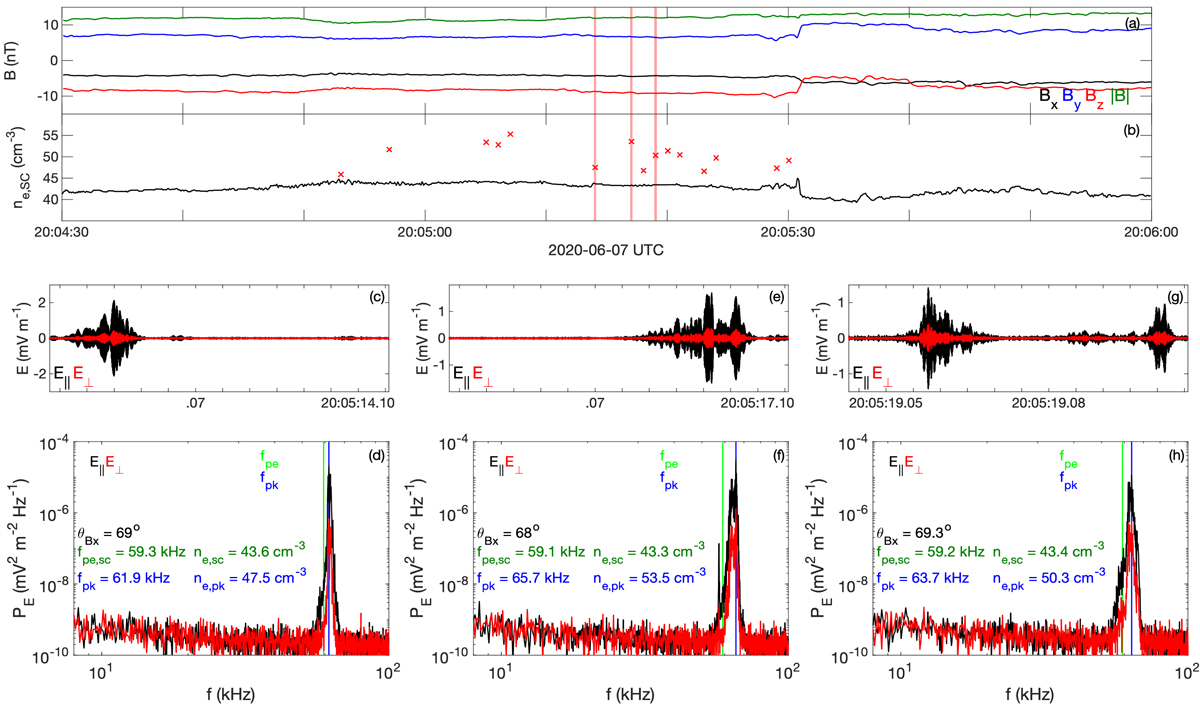
Langmuir waves observed near a solar wind current sheet on 2020 June 07. A series of Langmuir waves are observed with variable frequencies above the electron plasma frequency predicted from ne, SC. (a) B. (b) ne, SC. The red crosses indicate the TDS snapshots with Langmuir waves and the number density estimated from fpk. The three red shaded regions correspond to the three Langmuir wave examples in panels c–h. Panels c,e, and g: three Langmuir waveforms in field-aligned coordinates E∥ (black) and E⊥ (red). Panels d, f, and g: power spectra of E∥ (black) and E⊥ (red) associated with the Langmuir waveforms in panels c, e, and g, respectively.
Current usage metrics show cumulative count of Article Views (full-text article views including HTML views, PDF and ePub downloads, according to the available data) and Abstracts Views on Vision4Press platform.
Data correspond to usage on the plateform after 2015. The current usage metrics is available 48-96 hours after online publication and is updated daily on week days.
Initial download of the metrics may take a while.