Fig. 3.
Download original image
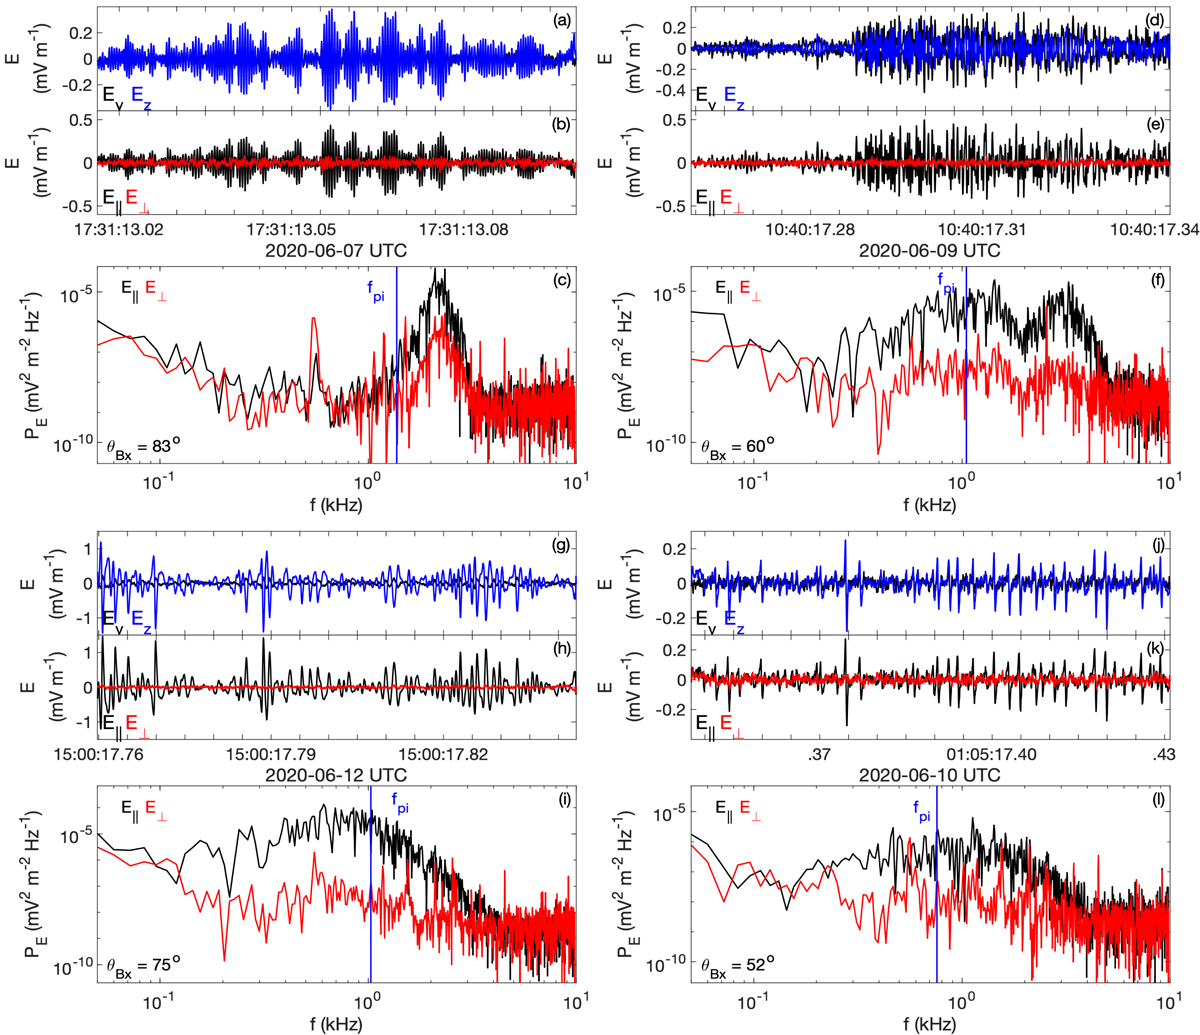
Four examples of ion-acoustic-like waves seen by LFR, shown in panels a–c, d–f, g–i, and j–l, respectively. For each event we plot Ey and Ez in panels a, d, g, and j, E∥ and E⊥ in b, e, h, and k, and the power spectra of E∥ and E⊥ in panels c, f, i, and l. Panels c, f, i, and l: the vertical blue line indicates the local ion plasma frequency fpi calculated from ne, SC.
Current usage metrics show cumulative count of Article Views (full-text article views including HTML views, PDF and ePub downloads, according to the available data) and Abstracts Views on Vision4Press platform.
Data correspond to usage on the plateform after 2015. The current usage metrics is available 48-96 hours after online publication and is updated daily on week days.
Initial download of the metrics may take a while.