Fig. 3.
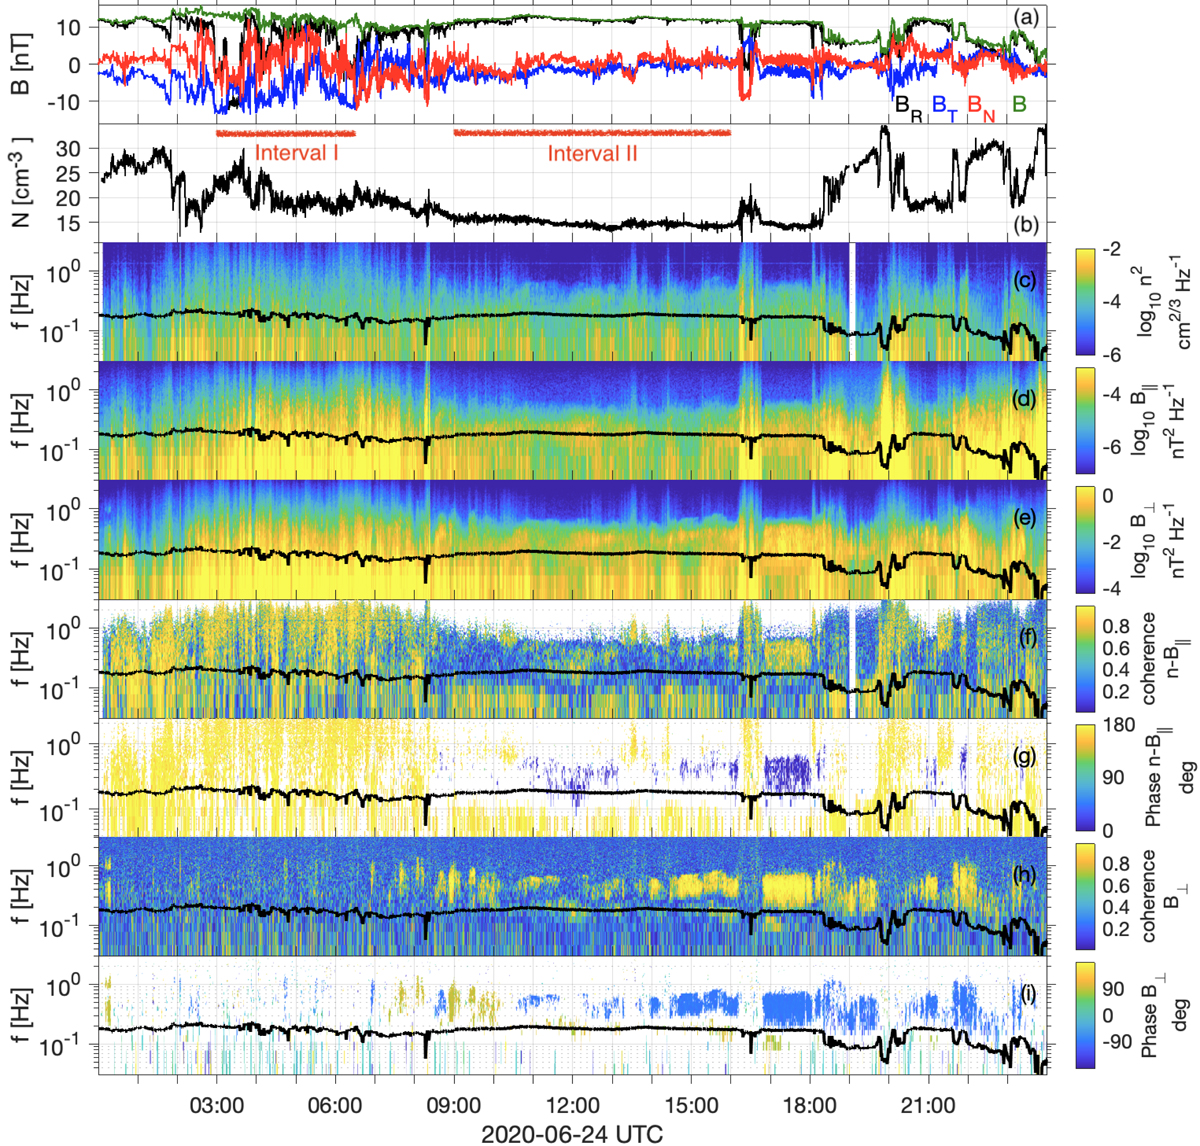
Download original image
Event overview. The event contains two specific intervals which we analyze in detail: interval I is dominated by turbulence and interval II with abundant coherent waves. Panels from top to bottom show: (a) magnetic field vector in RTN coordinates, (b) density ne, (c–e) power spectrum of density, B|| and B⊥ fluctuations, (f) coherence, and (g) phase between ne and B||, (h) coherence and (i) phase between the two B⊥ components The black lines in panels c-i show the proton cyclotron frequency, fcp.
Current usage metrics show cumulative count of Article Views (full-text article views including HTML views, PDF and ePub downloads, according to the available data) and Abstracts Views on Vision4Press platform.
Data correspond to usage on the plateform after 2015. The current usage metrics is available 48-96 hours after online publication and is updated daily on week days.
Initial download of the metrics may take a while.