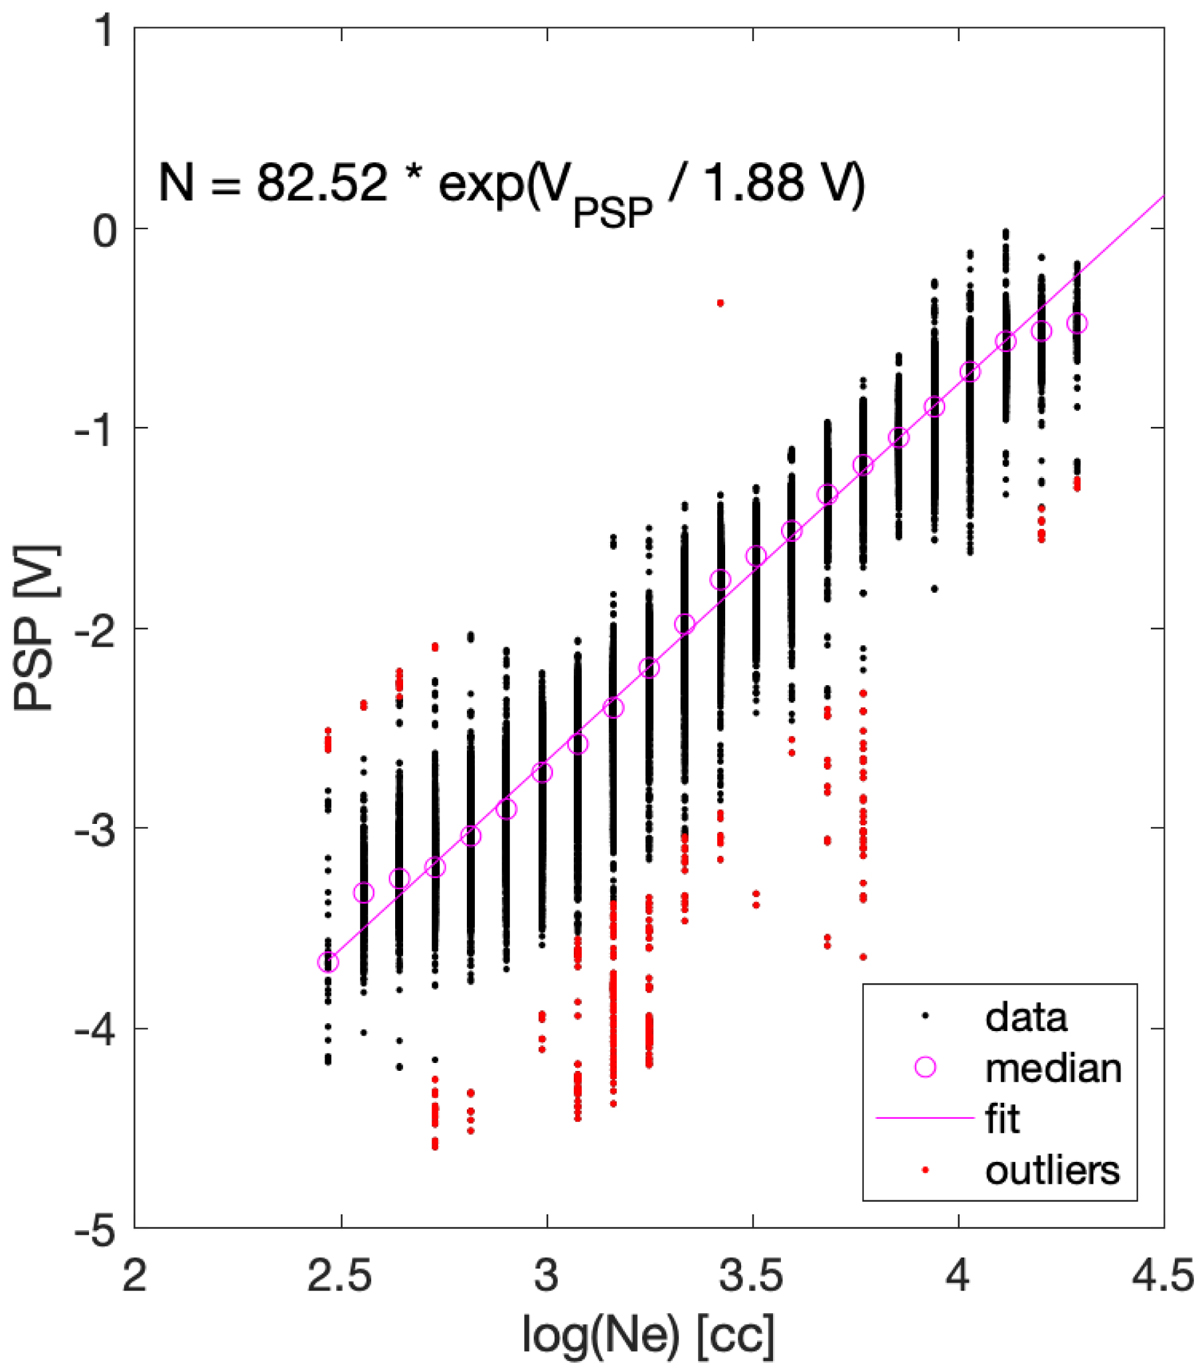
Fig. 1.
Download original image
Fit of VPSP to log(ne), where ne is the QTN-based density. The black dots show data points used for the linear fit (pink line) and red dots show points that were marked as outliers. The pink circles show the median values for each of the ne values. The data used in these plots corresponds to the time interval from May 30 to August 11, 2020, with most of the data points coming from June 2020.
Current usage metrics show cumulative count of Article Views (full-text article views including HTML views, PDF and ePub downloads, according to the available data) and Abstracts Views on Vision4Press platform.
Data correspond to usage on the plateform after 2015. The current usage metrics is available 48-96 hours after online publication and is updated daily on week days.
Initial download of the metrics may take a while.