Fig. 4.

Download original image
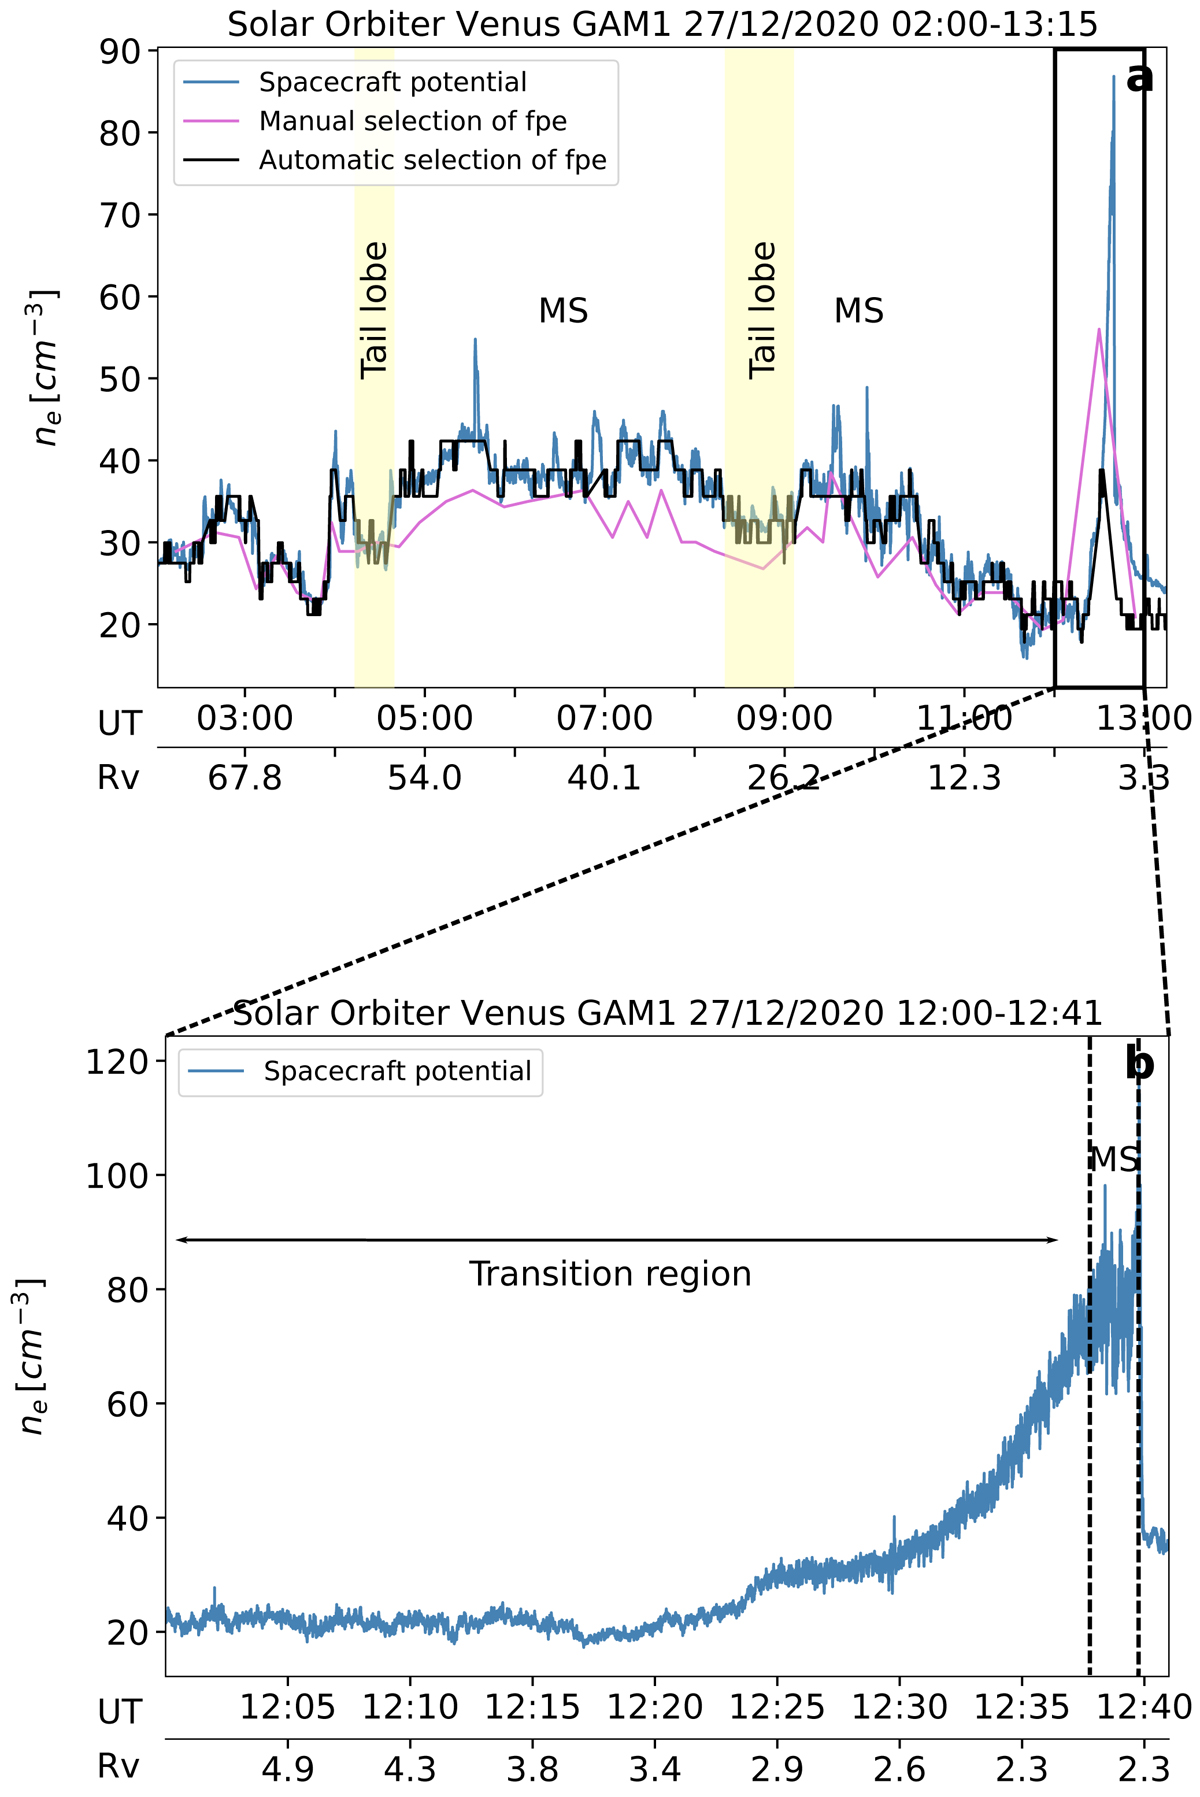
(a) Electron density as a function of time using the quasi-thermal noise spectroscopy technique with an automatic (black) and the manual (magenta) detection of the plasma peak. The blue curve represents the electron number densities inferred using the spacecraft potential data. (b) Zoom on ne between 12:00 and 12:41 UT. The dashed lines mark boundary crossings and transitions between different regions from the solar wind, to the magnetosheath (MS) and the lobe of the tail region (highlighted in yellow).
Current usage metrics show cumulative count of Article Views (full-text article views including HTML views, PDF and ePub downloads, according to the available data) and Abstracts Views on Vision4Press platform.
Data correspond to usage on the plateform after 2015. The current usage metrics is available 48-96 hours after online publication and is updated daily on week days.
Initial download of the metrics may take a while.


