Fig. 9.
Download original image
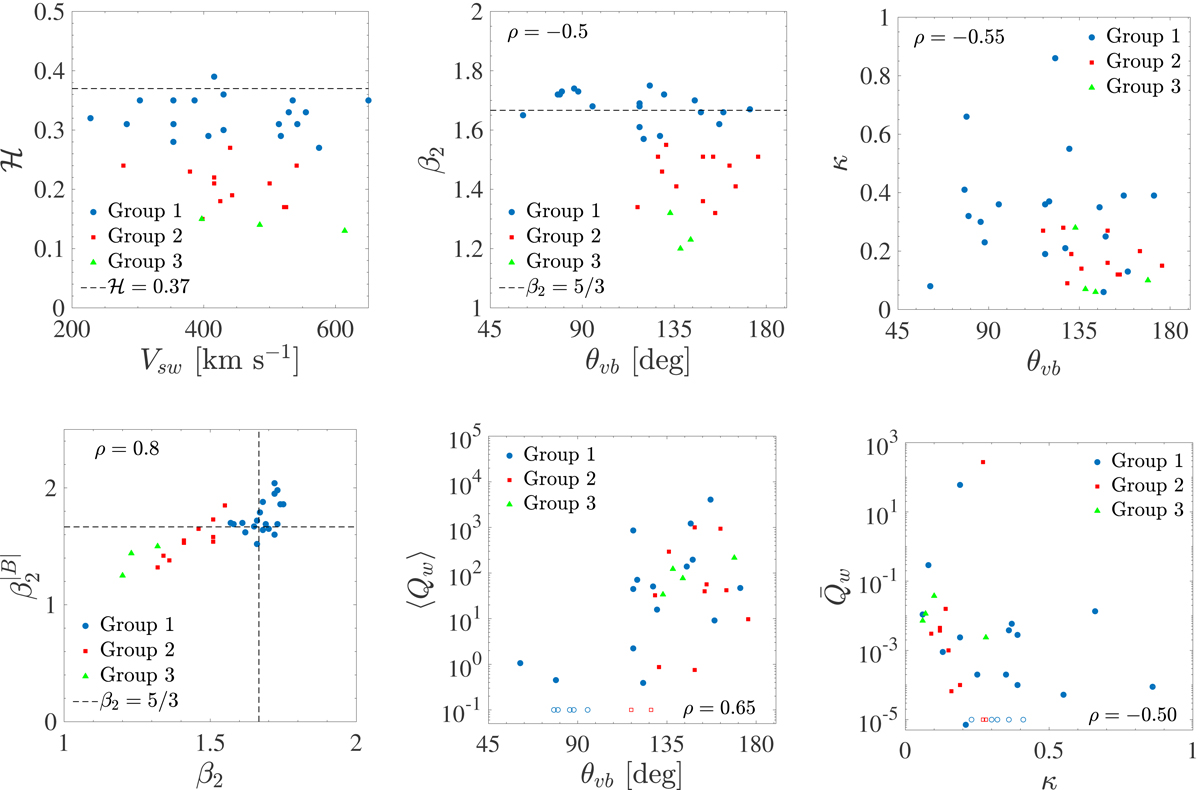
Scatter plots of pairs of solar wind, turbulence and wave parameters (see Tables 1 and A.1). Blue, red and green points indicate intervals of group 1, 2, and 3 respectively. Blue open circles in the bottom central and left panels represent intervals with wave zero parameters, for clarity, their value is set to 0.1 in order to be represented in the logarithmic vertical axis. Vertical and horizontal lines indicate standard fluid turbulence reference vales. The correlation coefficient is indicated (Table A.2).
Current usage metrics show cumulative count of Article Views (full-text article views including HTML views, PDF and ePub downloads, according to the available data) and Abstracts Views on Vision4Press platform.
Data correspond to usage on the plateform after 2015. The current usage metrics is available 48-96 hours after online publication and is updated daily on week days.
Initial download of the metrics may take a while.