Fig. 6.
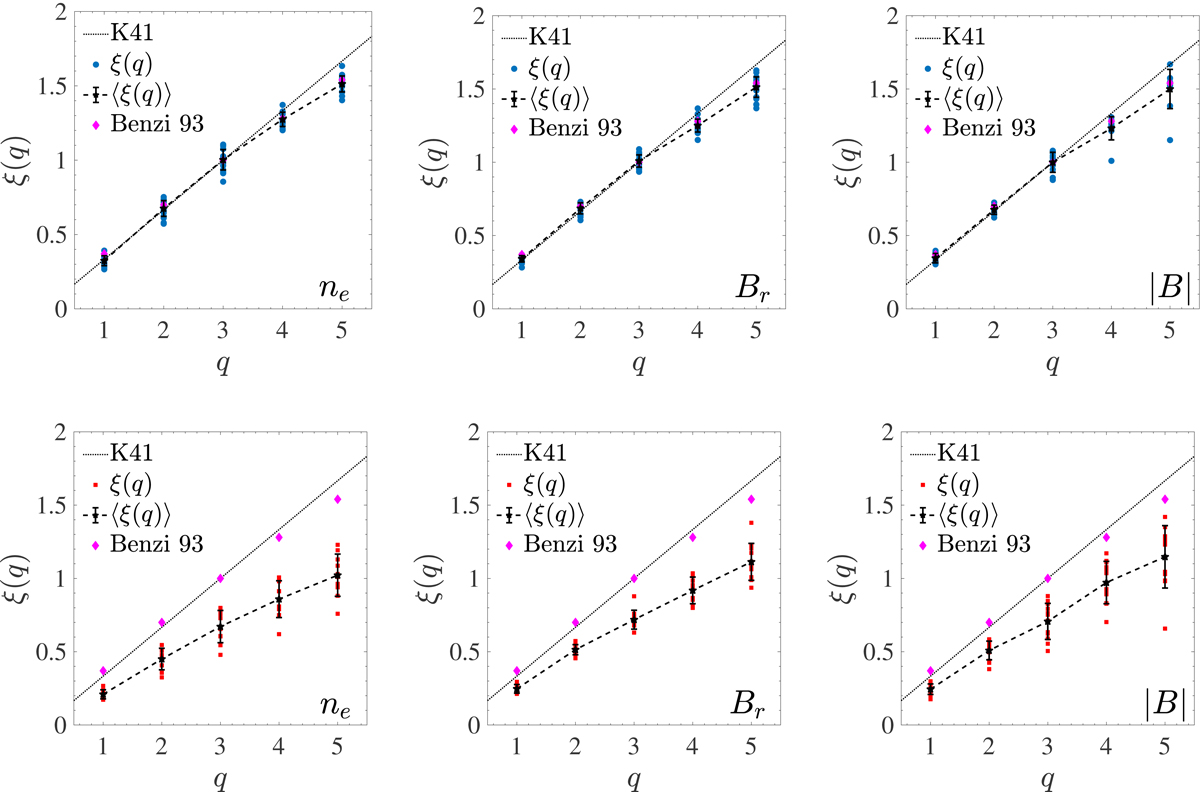
Download original image
Results of the equivalent structure function analysis. Top-left panel: HSA equivalent scaling exponents ξ(q) for group 1 (blue circles) and their average (black crosses). The exponents ζ(q) for velocity fluctuations in the inertial range of hydrodynamic turbulence (red squares) are shown for reference (Benzi et al. 1993). The dashed line represents the theoretical expectation ζ(q) = q/3 (Kolmogorov 1941). Top-center and top-right panels: equivalent scaling exponents for the magnetic field radial component Br and magnitude |B|, for group 1. Bottom panels: same as the top panels, but for the intervals of group 2.
Current usage metrics show cumulative count of Article Views (full-text article views including HTML views, PDF and ePub downloads, according to the available data) and Abstracts Views on Vision4Press platform.
Data correspond to usage on the plateform after 2015. The current usage metrics is available 48-96 hours after online publication and is updated daily on week days.
Initial download of the metrics may take a while.