Fig. 4.
Download original image
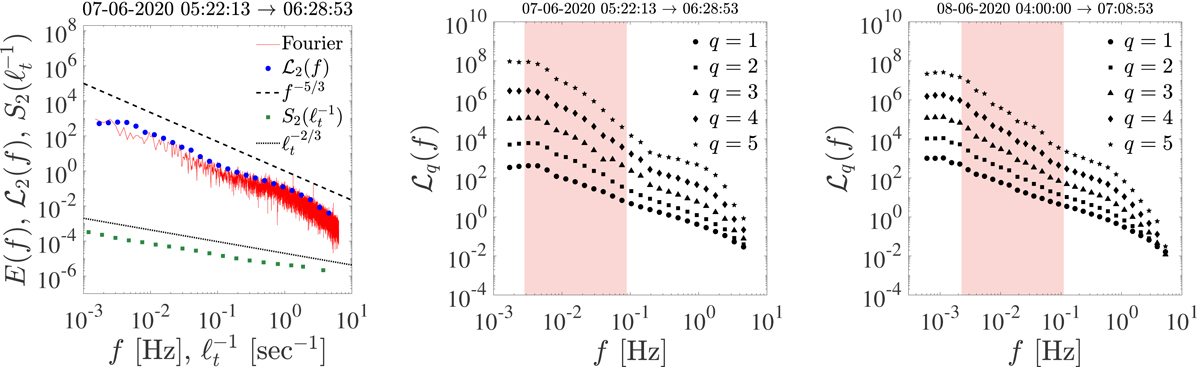
Results of the Hilbert-Huang analysis. Left panel: second-order Hilbert spectrum ℒ2(f) (blue circles), the classical Fourier PSD (Welch 1967) E(f) (red line), and the second-order structure function S2(ℓt) (green squares, plotted as a function of the inverse timescale ℓt), for sample 1. Power scaling is present in the same frequency range for all methods. The dashed line represents the classical Kolmogorov scaling ℒ2(f)∼f−5/3, while the dotted line represent the expected scaling for the second-order structure function ![]() (ζ(2) = β2 − 1). Central panel: generalized Hilbert spectra ℒq(f) for q ∈ [1, 5], obtained for sample 1. The curves have been vertically shifted for clarity. The shaded area represents the frequency range of the bootstrapping least-square fit. Right panel: same as in the central panel but for sample 9. The power behavior is still present, but the power law exponents are considerably different.
(ζ(2) = β2 − 1). Central panel: generalized Hilbert spectra ℒq(f) for q ∈ [1, 5], obtained for sample 1. The curves have been vertically shifted for clarity. The shaded area represents the frequency range of the bootstrapping least-square fit. Right panel: same as in the central panel but for sample 9. The power behavior is still present, but the power law exponents are considerably different.
Current usage metrics show cumulative count of Article Views (full-text article views including HTML views, PDF and ePub downloads, according to the available data) and Abstracts Views on Vision4Press platform.
Data correspond to usage on the plateform after 2015. The current usage metrics is available 48-96 hours after online publication and is updated daily on week days.
Initial download of the metrics may take a while.