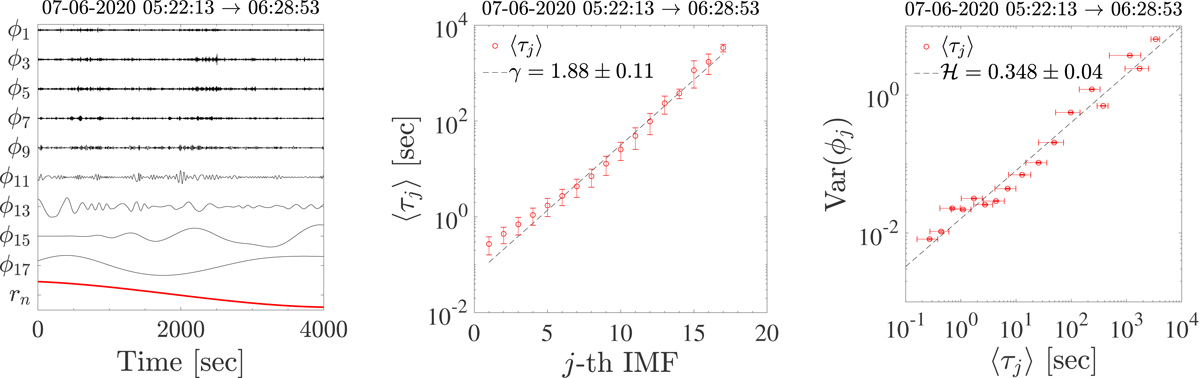
Fig. 3.
Download original image
Results of the EMD analysis. Left panel: example of IMFs ϕj(t) for sample 1 (black lines). The bottom plot (red line) represents the residual rn(t). For better readability, only odd IMFs have been plotted. Central panel: average timescale ⟨τj⟩ of each IMF of sample 1 as a function of the mode j. Error bars represent the 95% confidence bounds. The dashed line is a least square fit obtained from the relation ⟨τj⟩=αγj. Right panel: IMF variance Var(ϕj) as a function of the average period ⟨τj⟩ for sample 1, with the associated 95% confidence bounds. The dashed line represents the relation Var(ϕj)∼⟨τj⟩2ℋ, being ℋ the Hurst number (see the list for all intervals in Table A.1).
Current usage metrics show cumulative count of Article Views (full-text article views including HTML views, PDF and ePub downloads, according to the available data) and Abstracts Views on Vision4Press platform.
Data correspond to usage on the plateform after 2015. The current usage metrics is available 48-96 hours after online publication and is updated daily on week days.
Initial download of the metrics may take a while.