Fig. 8.
Download original image
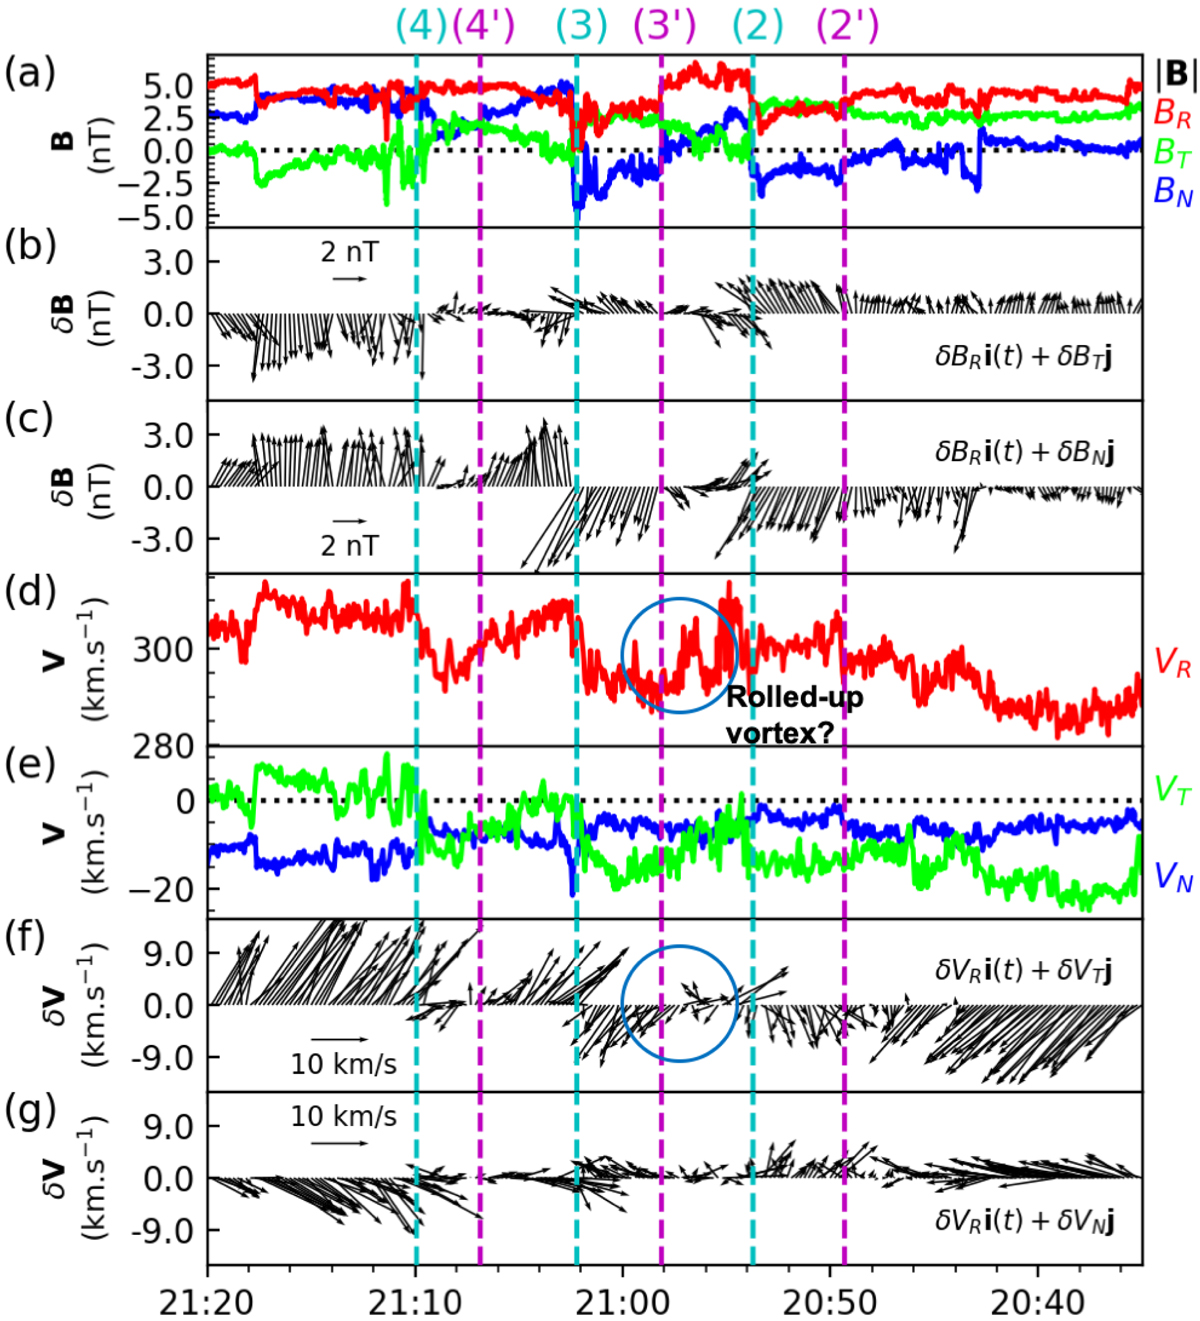
Magnetic and velocity fields with their perturbations from the average shown with time progresses from right to left. Inbound and outbound crossings are marked with purple and cyan vertical dashed lines, respectively. (a) Magnetic fields. (b,c) Magnetic field fluctuations from the averages in the R − T and R − N planes, respectively. (d) Ion bulk velocity VR component. (e) Ion bulk velocity VT and VN components. (f,g) Velocity field perturbations in the R − T and R − N planes, respectively.
Current usage metrics show cumulative count of Article Views (full-text article views including HTML views, PDF and ePub downloads, according to the available data) and Abstracts Views on Vision4Press platform.
Data correspond to usage on the plateform after 2015. The current usage metrics is available 48-96 hours after online publication and is updated daily on week days.
Initial download of the metrics may take a while.