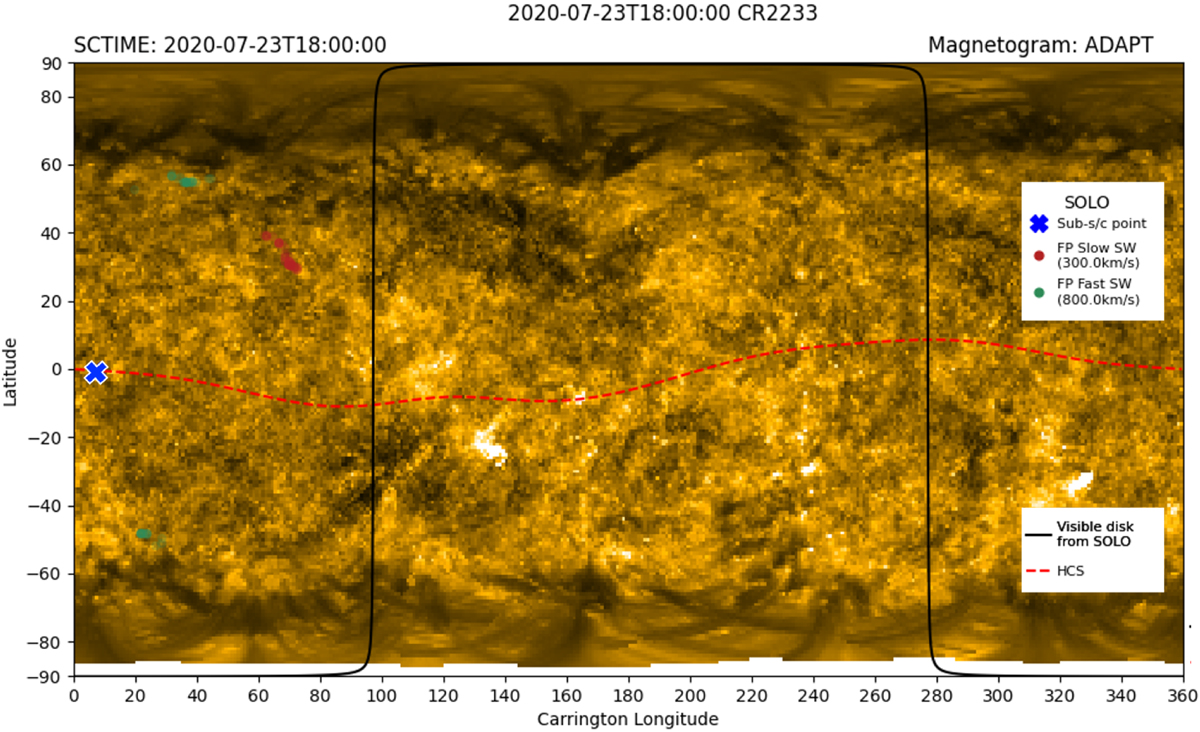
Fig. 2.
Download original image
Connectivity map of the observations on July 23, 2020, produced from the Connectivity Tool (Rouillard et al. 2020) to provide a global context. The background is a combined image from remote observation using SDO/AIA and STEREO-A/EUVI 171 Å Carrington maps. The blue cross represents the region of high connectivity probability of SolO to the solar wind source regions. The green and red dots represent zones of the high connectivity probability to the solar wind source regions assuming fast and slow winds, respectively. The heliospheric current sheet (HCS) is marked with a red dashed line.
Current usage metrics show cumulative count of Article Views (full-text article views including HTML views, PDF and ePub downloads, according to the available data) and Abstracts Views on Vision4Press platform.
Data correspond to usage on the plateform after 2015. The current usage metrics is available 48-96 hours after online publication and is updated daily on week days.
Initial download of the metrics may take a while.