Fig. 10.
Download original image
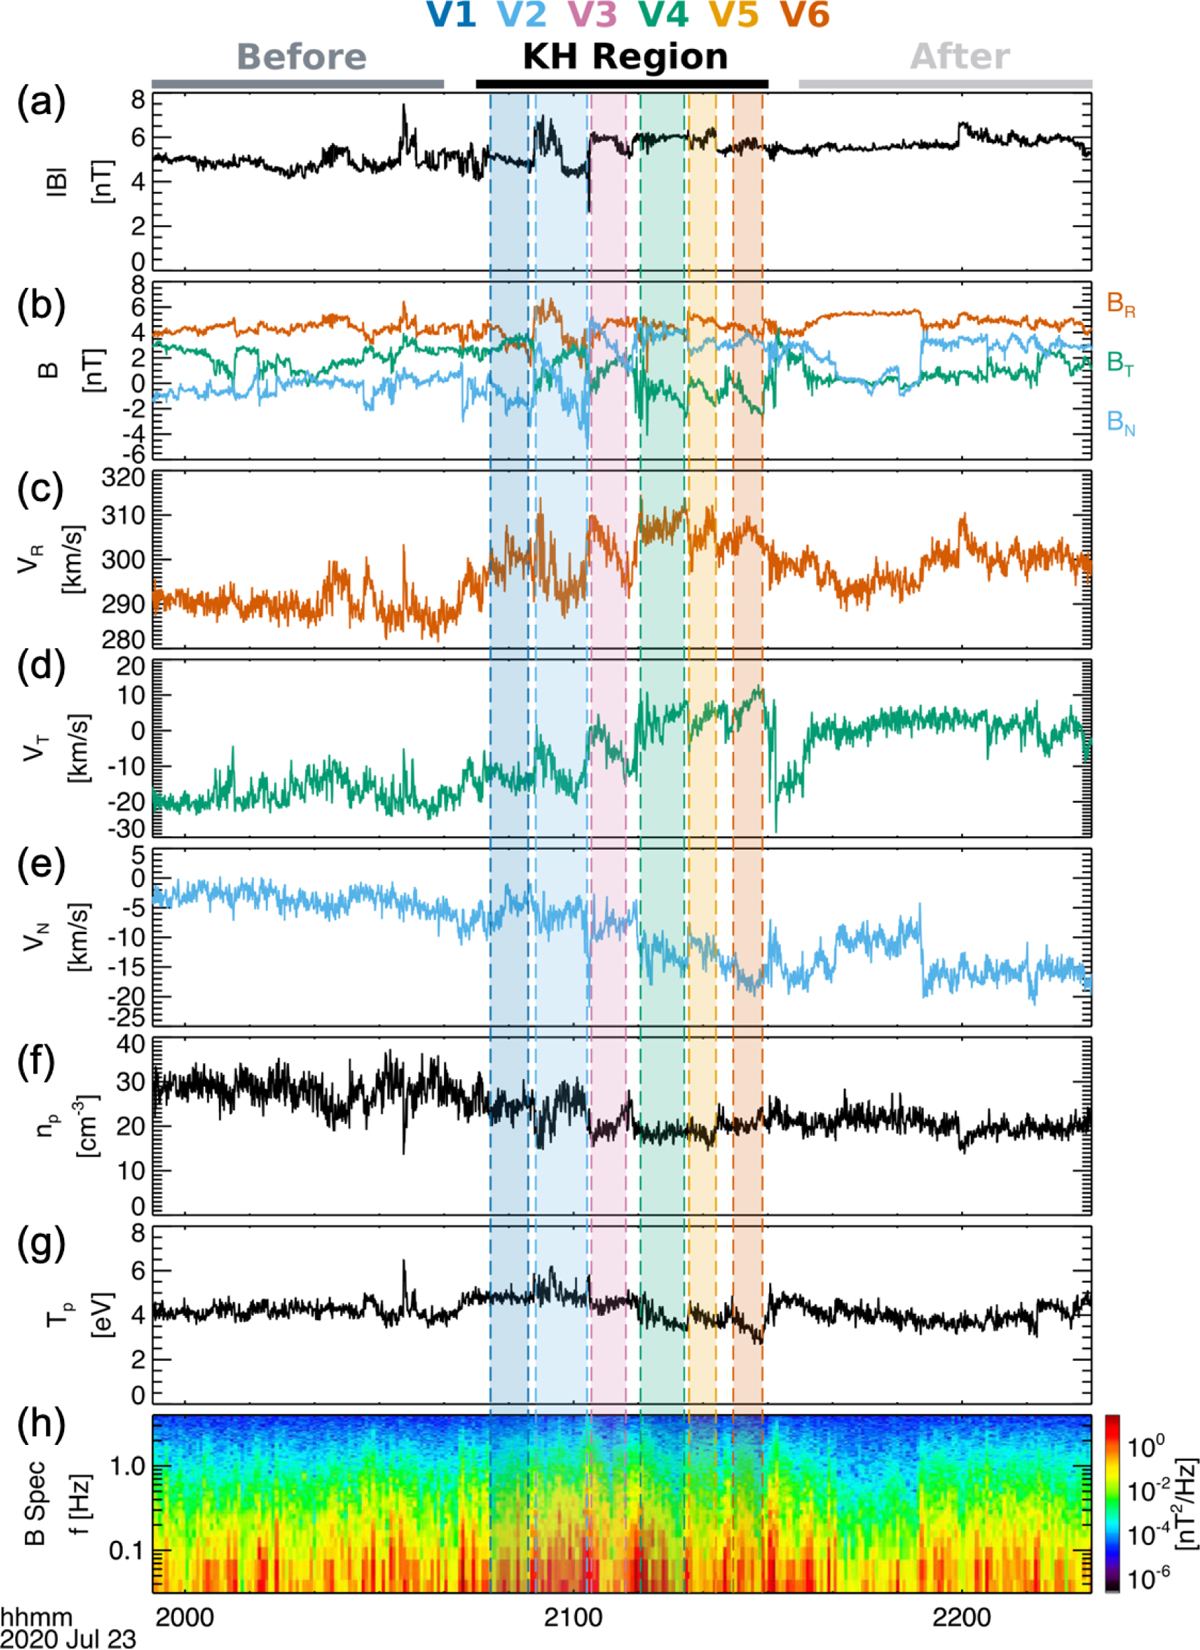
Overview of the intervals for magnetic spectrum analysis. The KH region is marked in the middle (see top) together with the intervals before (top left) and after (top right). The KH vortices V1 to V6, marked between the compressed current sheets, are shaded in colors. (a) Total magnetic field. (b) Magnetic field in the RTN system. (c–e) Velocity field VR, VT, and VN components, respectively. (f) Ion number density. (g) Ion temperature. (h) Magnetic spectrum.
Current usage metrics show cumulative count of Article Views (full-text article views including HTML views, PDF and ePub downloads, according to the available data) and Abstracts Views on Vision4Press platform.
Data correspond to usage on the plateform after 2015. The current usage metrics is available 48-96 hours after online publication and is updated daily on week days.
Initial download of the metrics may take a while.