Fig. 3.
Download original image
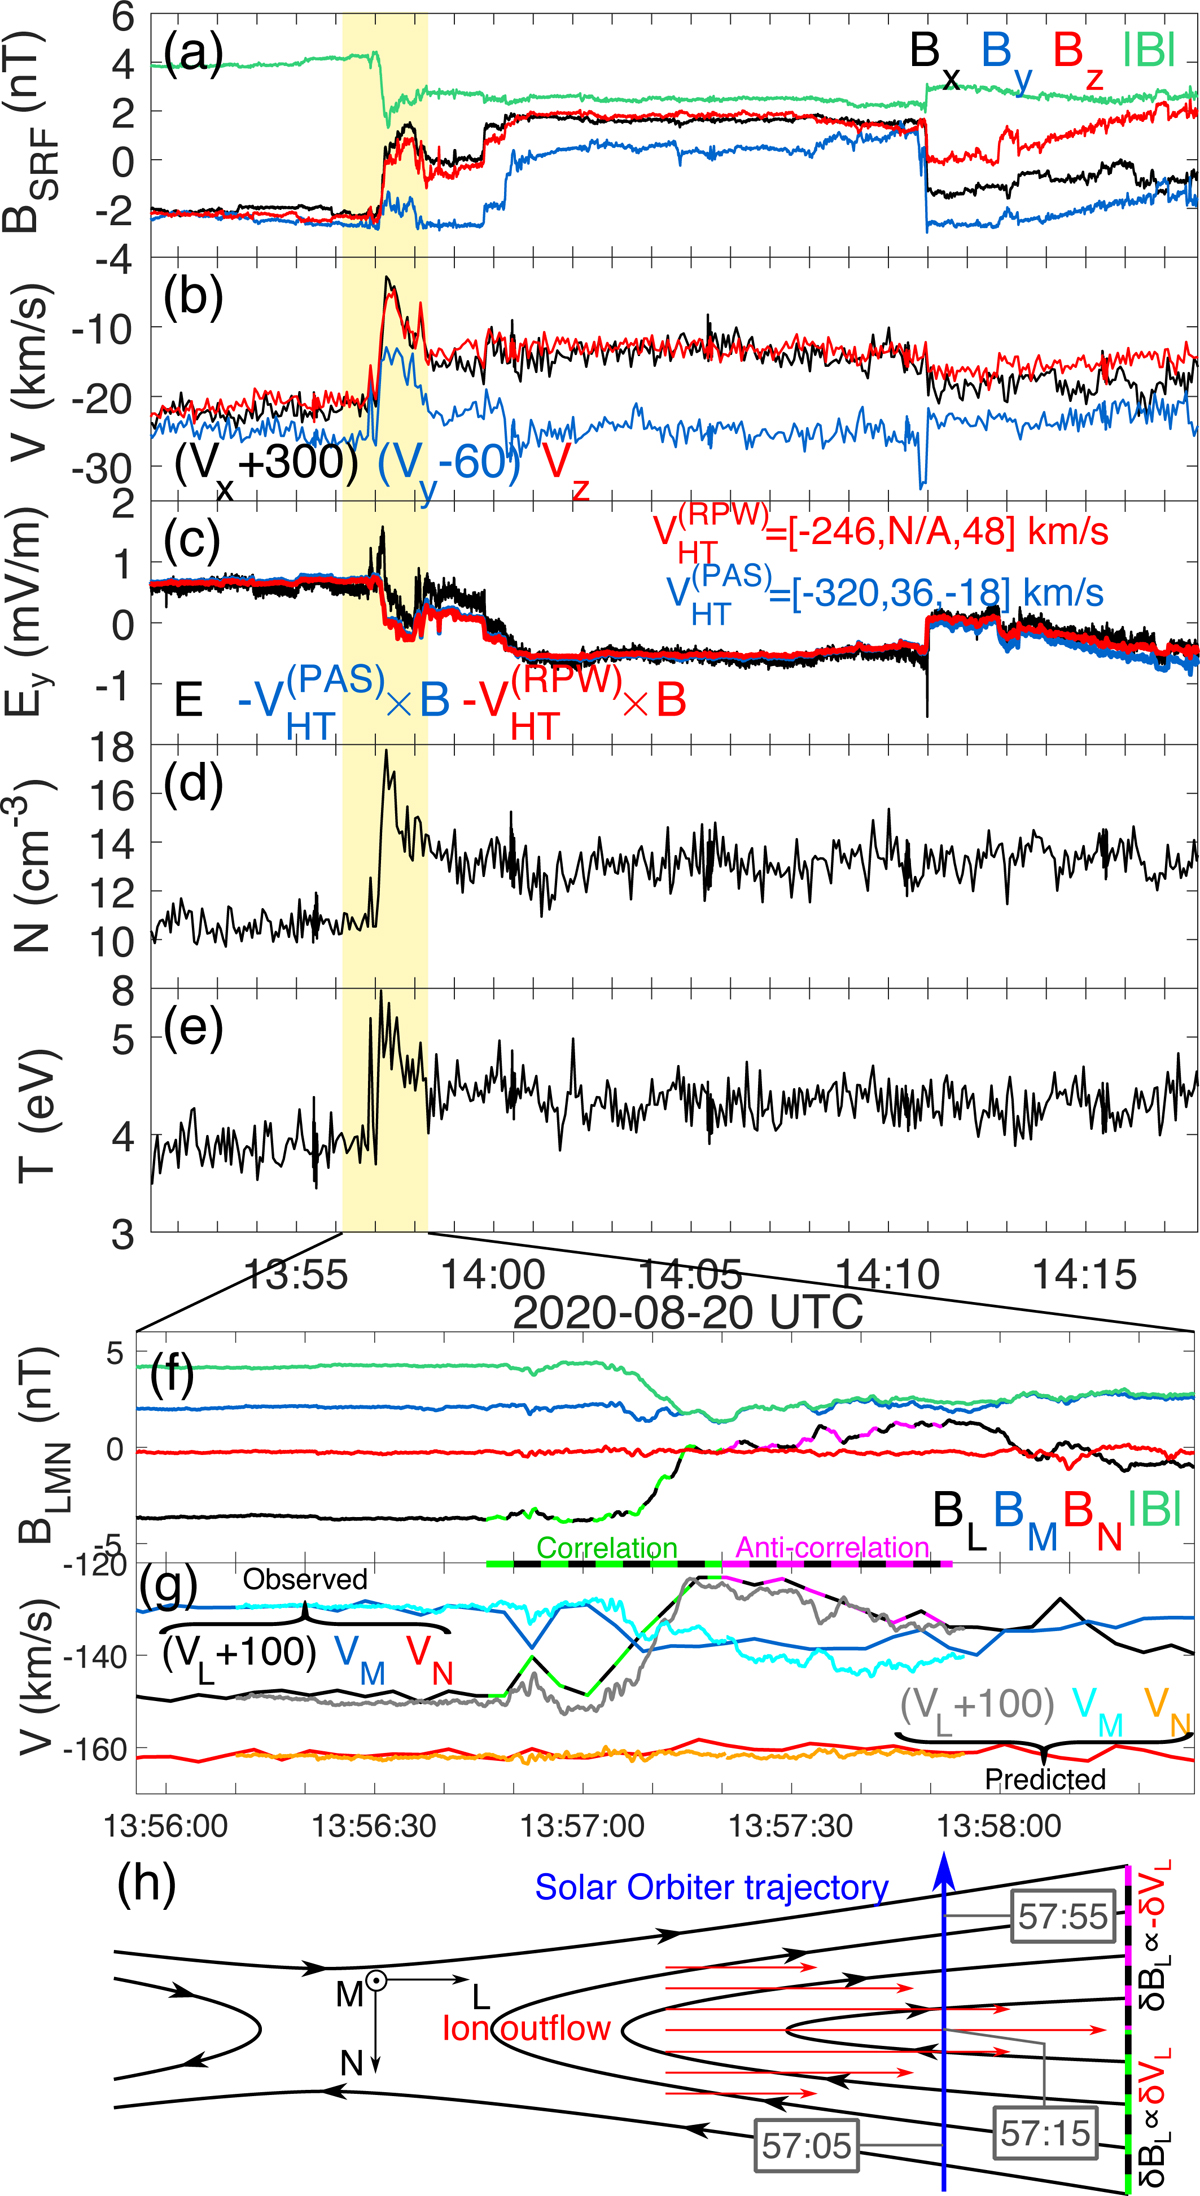
Observations of a reconnecting current sheet. Panels a,b: magnetic field and ion velocity in SRF. Panel c: Ey and −(vHT × B)y with vHT from PAS (blue) and RPW (red). Panels d,e: ion density and temperature from PAS. Panel f: magnetic field in LMN coordinates at the reconnection jet. Panel g: observed (black, blue, red) and predicted (green, cyan, orange) plasma velocities in LMN coordinates. The green and magenta dashed horizontal bars highlight where BL and VL are correlated and anti-correlated, respectively. Panel h: simplified sketch of the reconnection event illustrating the expected correlation and anti-correlation between BL and VL.
Current usage metrics show cumulative count of Article Views (full-text article views including HTML views, PDF and ePub downloads, according to the available data) and Abstracts Views on Vision4Press platform.
Data correspond to usage on the plateform after 2015. The current usage metrics is available 48-96 hours after online publication and is updated daily on week days.
Initial download of the metrics may take a while.