Free Access
Fig. 4
Download original image
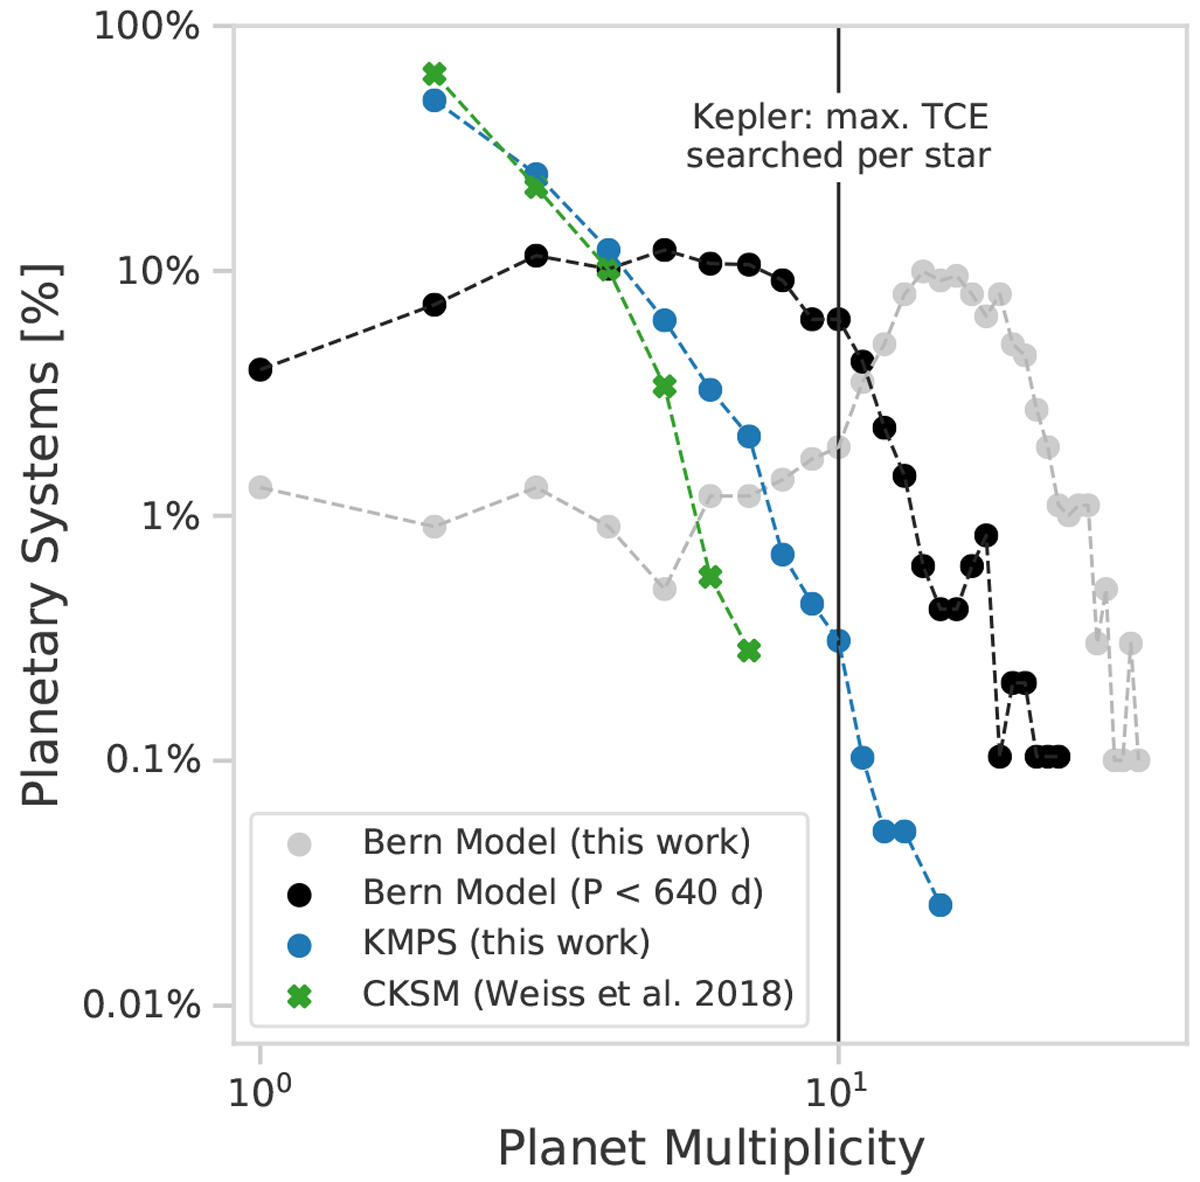
Distribution of planetary multiplicity: Bern Model in grey, Bern Model detectable planets (P < 640 days) in black, KMPS in blue, and observed CKSM in green. The solid black line indicates the maximum number of TCE searches for a star performed by the Kepler pipeline.
Current usage metrics show cumulative count of Article Views (full-text article views including HTML views, PDF and ePub downloads, according to the available data) and Abstracts Views on Vision4Press platform.
Data correspond to usage on the plateform after 2015. The current usage metrics is available 48-96 hours after online publication and is updated daily on week days.
Initial download of the metrics may take a while.