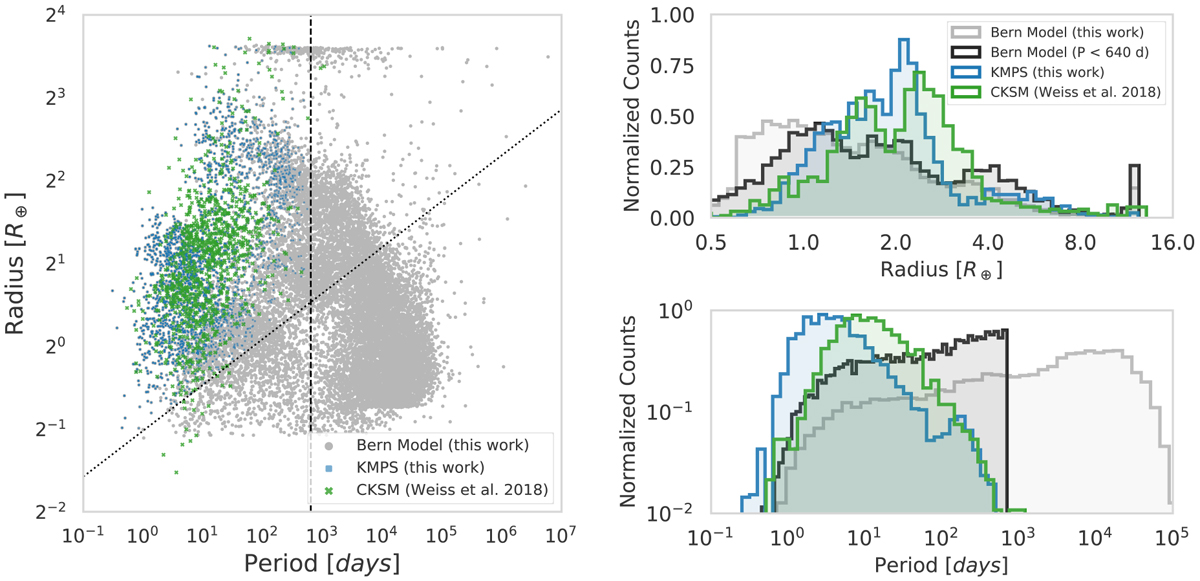
Fig. 3
Download original image
Comparison of planetary populations. Theoretical (blue) represents planets in KOBE multi-planetary systems (KMPS) and observations (green) are the CKS multi-planetary systems (CKSM). Left: Scatter plot with planetary radius on the y-axis and period on the x-axis. The dashed line shows the maximum period of a planet that can be found by KOBE. The dotted line shows the minimum radius of a planet around a 1 R⊙ star for producing a transit S/N of 10. The underlying theoretical population is shown in grey. Right: Comparison of radius (top)and period (bottom) distributions. The radius valley can be clearly seen in the planets found by KOBE and the California-Kepler survey.
Current usage metrics show cumulative count of Article Views (full-text article views including HTML views, PDF and ePub downloads, according to the available data) and Abstracts Views on Vision4Press platform.
Data correspond to usage on the plateform after 2015. The current usage metrics is available 48-96 hours after online publication and is updated daily on week days.
Initial download of the metrics may take a while.