Fig. 13
Download original image
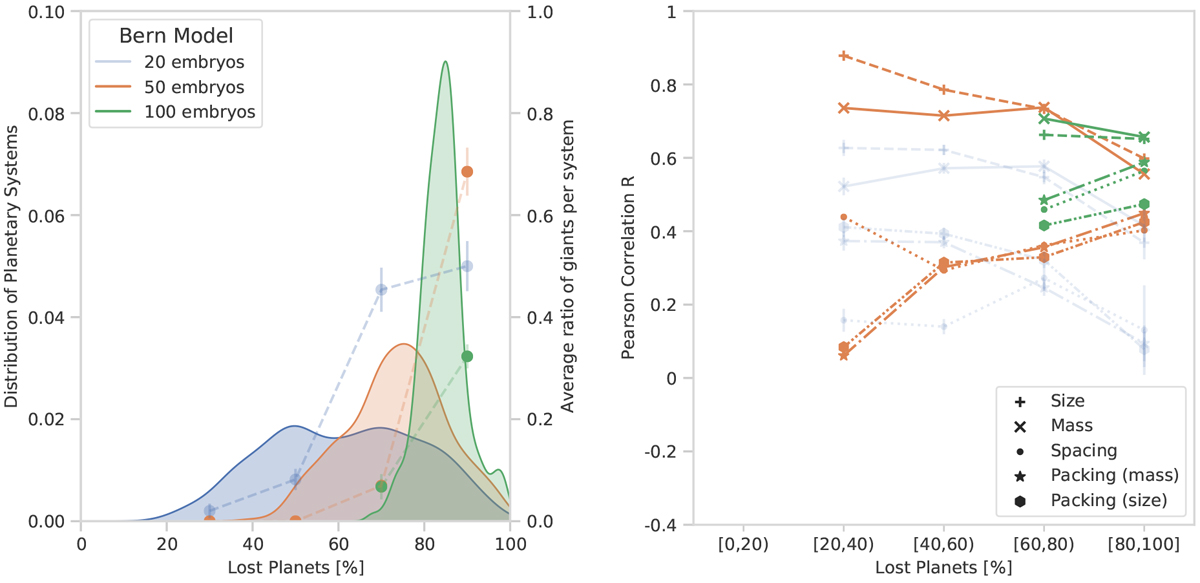
Role of dynamical interactions on the peas in a pod trends. Left: distribution of lost planets [%] by systems in the 20-, 50-, and 100-embryo NGPPS populations. The fraction of planets lost by a system can be used as a proxy for the cumulative dynamical interactions experienced by a system. The dashed lines show the ratio of giant planets per system averaged over bins. Right: correlation coefficient for the peas in a pod trends for each bin. The error bars correspond to the standard error of the correlation coefficient (Zar 2014). Increasing dynamical interactions results in the strengthening of the spacing and packing trend.
Current usage metrics show cumulative count of Article Views (full-text article views including HTML views, PDF and ePub downloads, according to the available data) and Abstracts Views on Vision4Press platform.
Data correspond to usage on the plateform after 2015. The current usage metrics is available 48-96 hours after online publication and is updated daily on week days.
Initial download of the metrics may take a while.