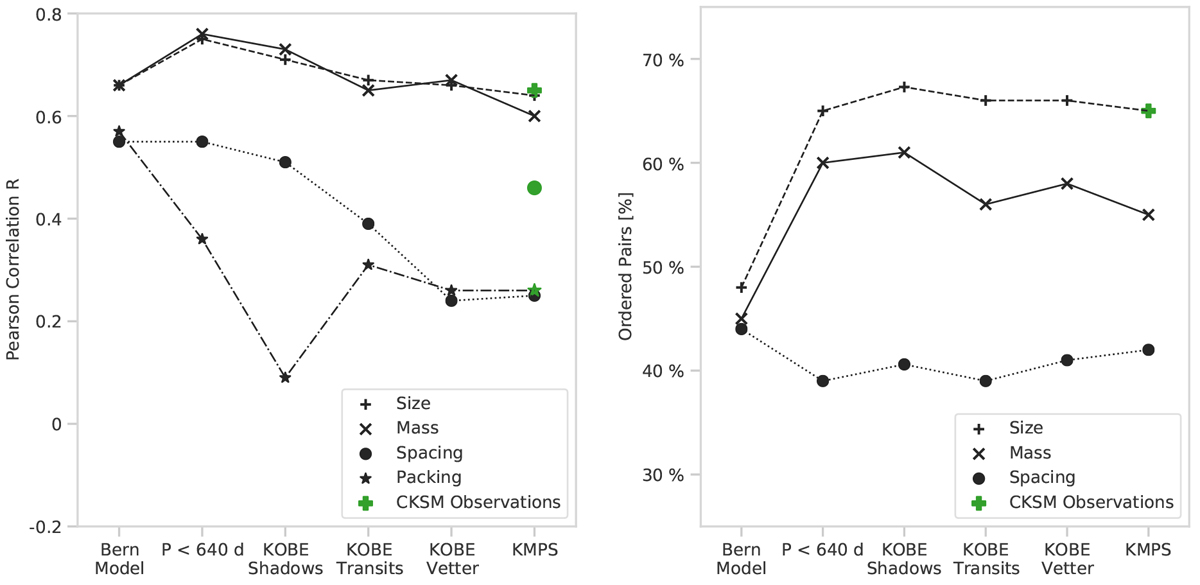
Fig. 11
Download original image
Influence of the geometrical limitations of the transit method (KOBE-Shadows), the transit detection biases (KOBE-Transits), and the completeness of the Kepler survey (KOBE-Vetter) on the peas in a pod trend. The plot shows how the correlation coefficients (left) and the frequency of ordered pairs (right) varies in the underlying Bern Model population, the underlying population of detectable planets (P < 640 days), and the theoretically observed KMPS population (for the size–mass trends in the KMPS catalogue adjacent planetary pairs have undergone a swapping test, as mentioned in Sect. 6.1). Observations from the CKSM exoplanetary catalogue are shown in green.
Current usage metrics show cumulative count of Article Views (full-text article views including HTML views, PDF and ePub downloads, according to the available data) and Abstracts Views on Vision4Press platform.
Data correspond to usage on the plateform after 2015. The current usage metrics is available 48-96 hours after online publication and is updated daily on week days.
Initial download of the metrics may take a while.