Fig. 10
Download original image
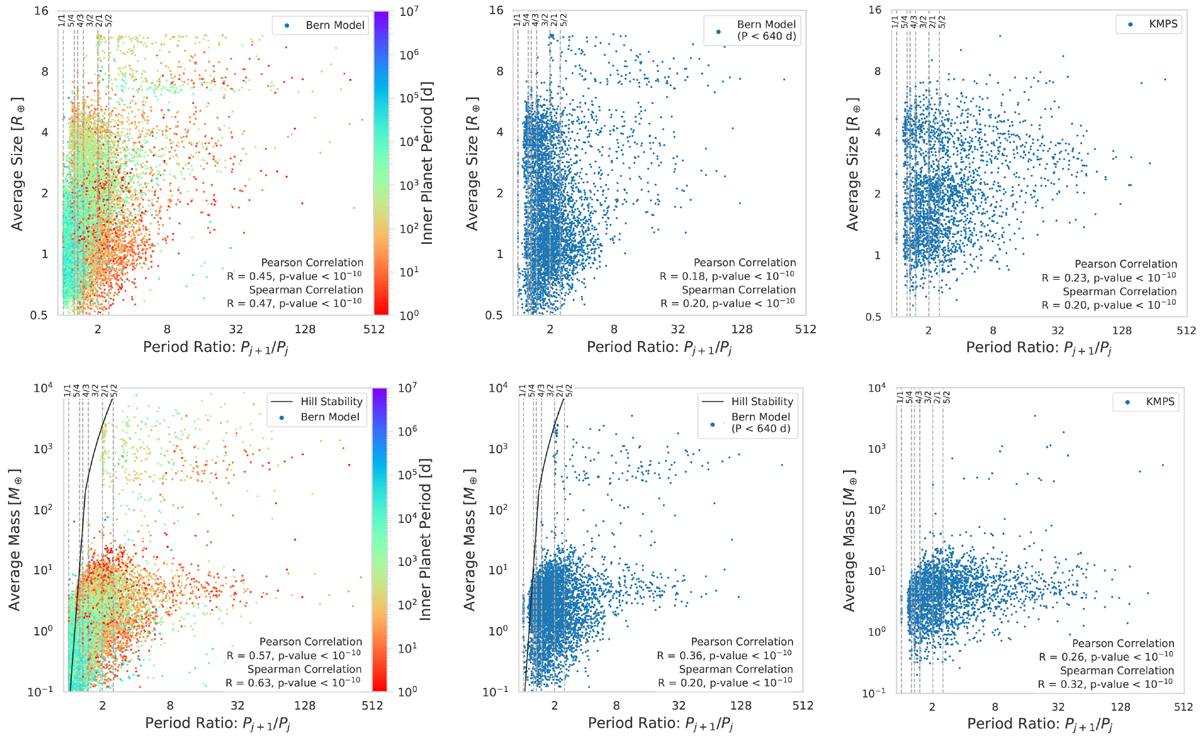
Peas in a pod: packing. The average sizes (top) and average masses (bottom) of adjacent planets are shown as a function of their orbital period ratios Pj+1 ∕Pj for the underlying population (left), underlying population of detectable planets (middle), and KMPS planets (right). For the underlying population, the position of the inner planet in each pair is in a different colour, showing that the trend is due to those planetary pairs where the inner planet is close to the host star. The black curveshows the Hill stability criterion from Deck et al. (2013). Adjacent planetary pairs on the right side of this curve are Hill stable. Points on the left side are Hill unstable and will probably be removed with longer N-body calculations.
Current usage metrics show cumulative count of Article Views (full-text article views including HTML views, PDF and ePub downloads, according to the available data) and Abstracts Views on Vision4Press platform.
Data correspond to usage on the plateform after 2015. The current usage metrics is available 48-96 hours after online publication and is updated daily on week days.
Initial download of the metrics may take a while.