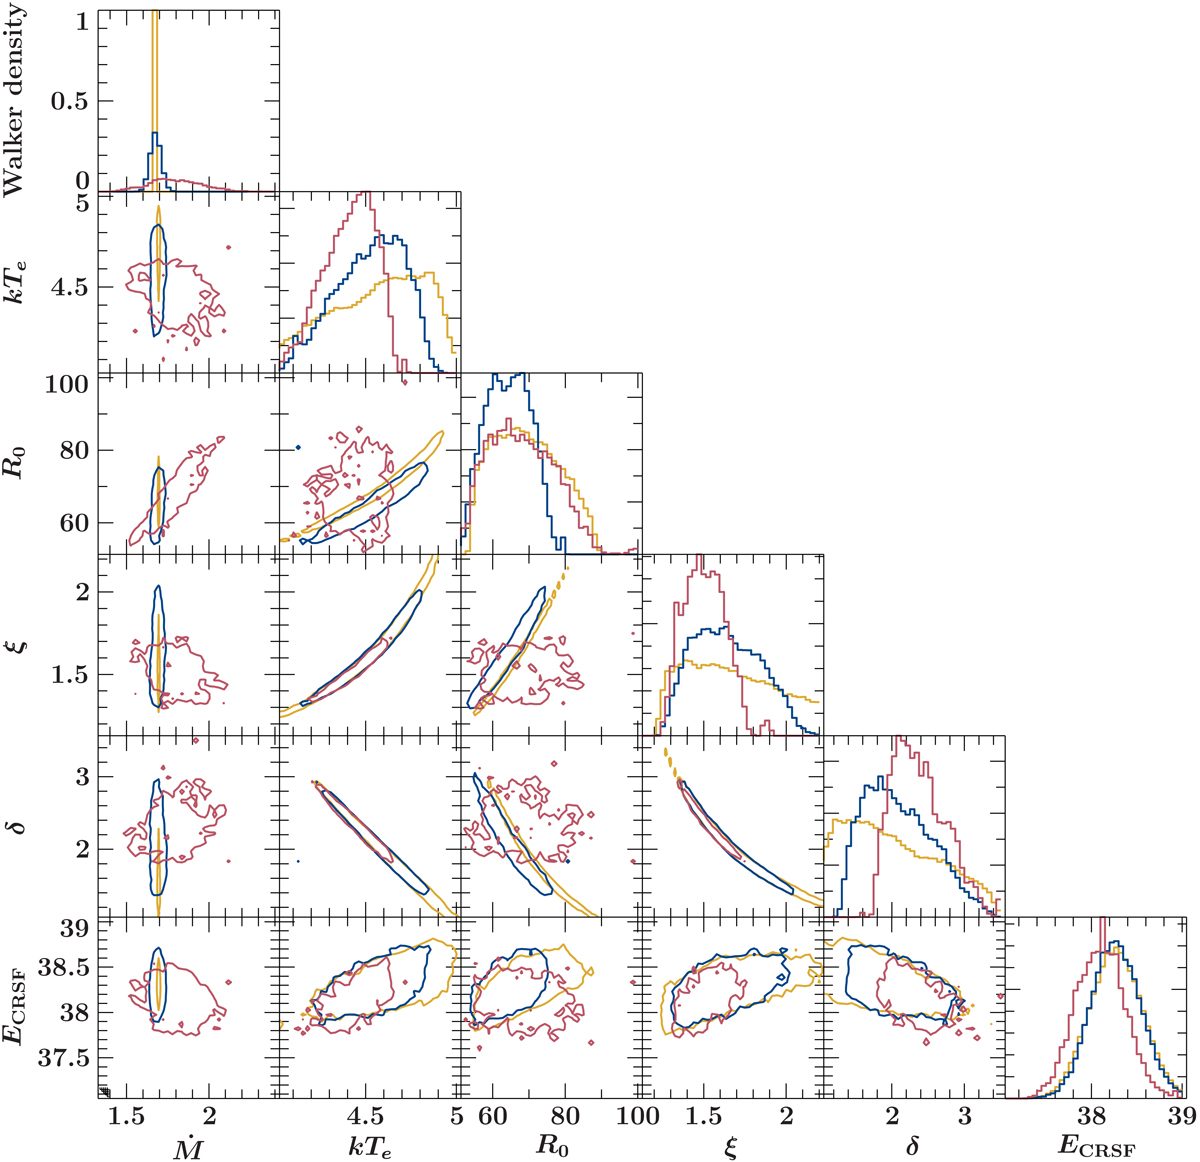
Fig. 5.
Download original image
One- and two-dimensional marginal posterior density distributions derived from the MCMC walker distribution. In red the distributions for a free accretion rate, in blue the distribution under the influence of the constraint and in yellow with Ṁ fixed to the value found with the help of the constraint. The solid lines in the two-dimensional subplots denote the 1-sigma contours of the walker distribution.
Current usage metrics show cumulative count of Article Views (full-text article views including HTML views, PDF and ePub downloads, according to the available data) and Abstracts Views on Vision4Press platform.
Data correspond to usage on the plateform after 2015. The current usage metrics is available 48-96 hours after online publication and is updated daily on week days.
Initial download of the metrics may take a while.