Free Access
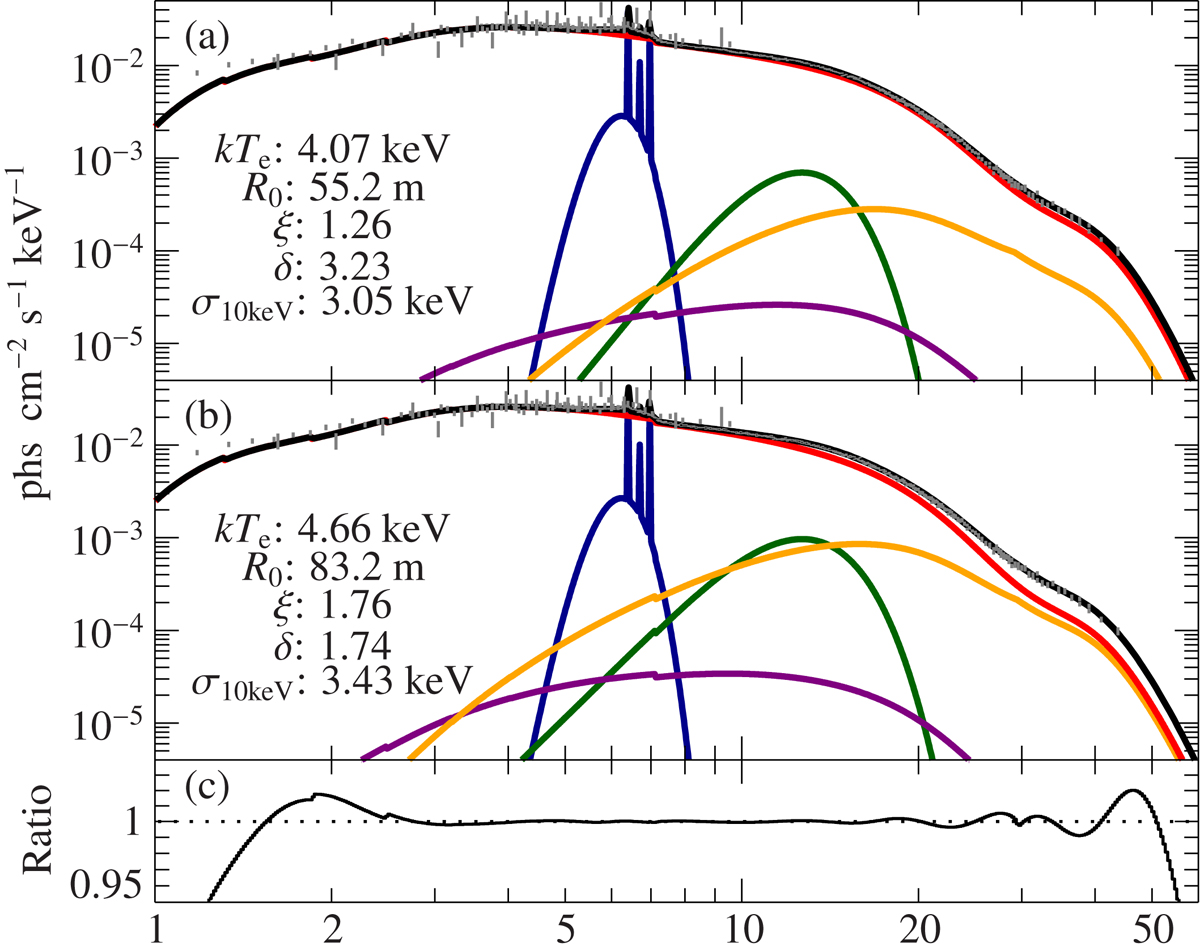
Fig. 4.
Download original image
Similar to the upper panel in Fig. 3 the two plots of the unfolded spectrum display individual model components and demonstrate the spectral change along the parameter correlation. a: model components for a small column radius. b: model components for a larger column radius. c: ratio between the high and low radius model.
Current usage metrics show cumulative count of Article Views (full-text article views including HTML views, PDF and ePub downloads, according to the available data) and Abstracts Views on Vision4Press platform.
Data correspond to usage on the plateform after 2015. The current usage metrics is available 48-96 hours after online publication and is updated daily on week days.
Initial download of the metrics may take a while.