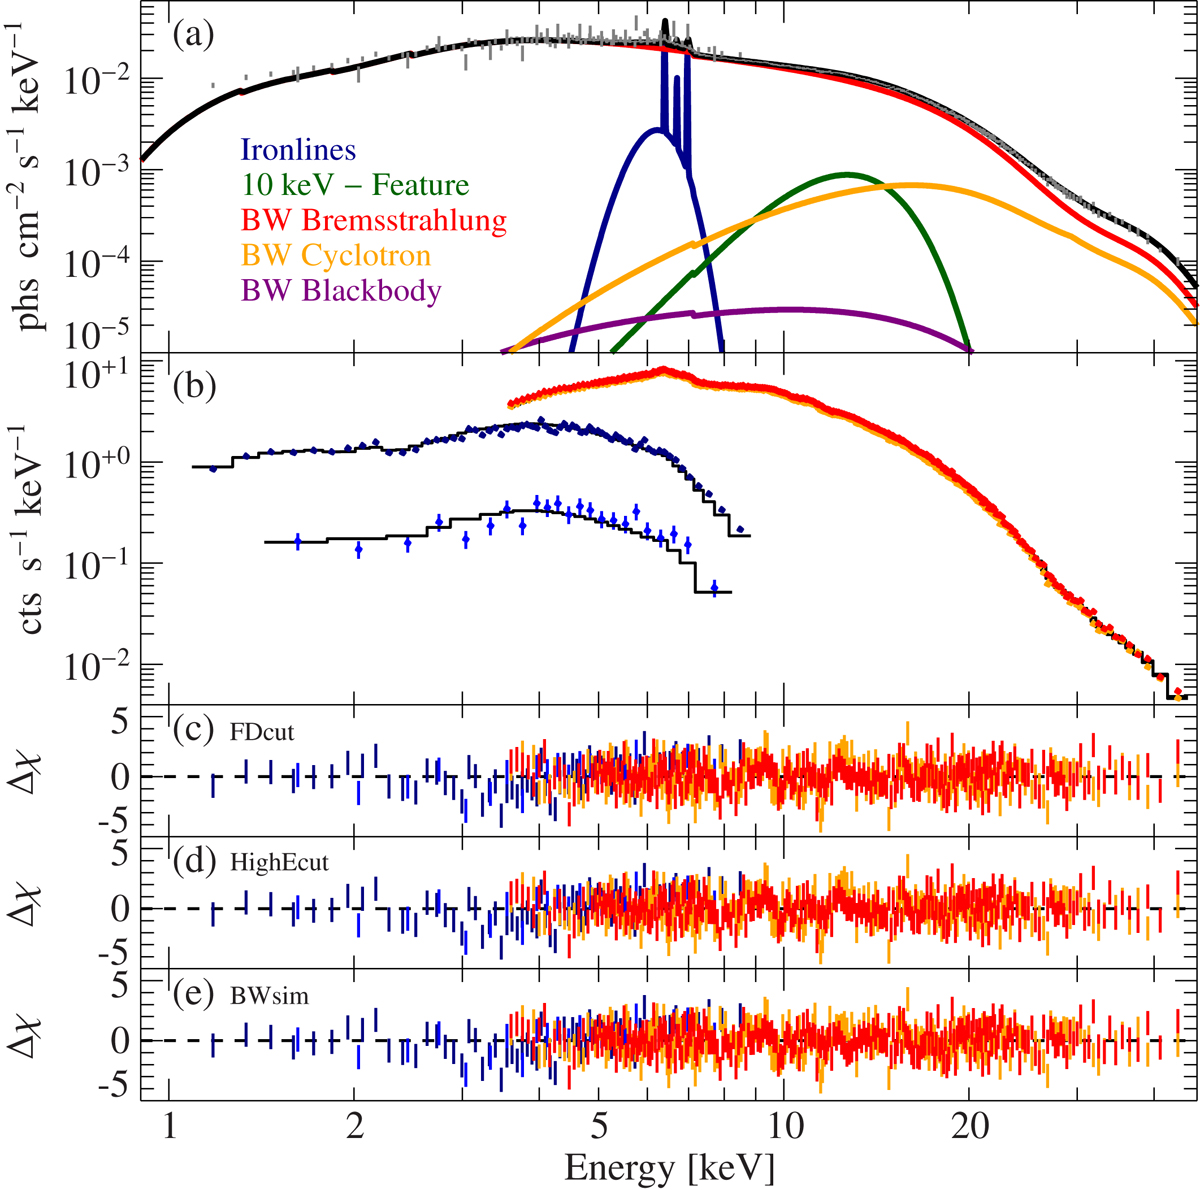
Fig. 3.
Download original image
Spectrum of Cen X-3 as seen by NuSTAR and Swift. a: unfolded spectrum and the different components of the BWsim best-fit model. The difference between the unfolded data points and the model is caused by the algorithm used to unfold the data. In black the full spectrum is shown and colored are the different components. b: spectrum fitted with BWsim. Red and orange indicate the data from the two focal plane modules of NuSTAR and shown in dark and light blue is the Swift data in window timing and photon counting mode. c–e: residuals for the FDcut, HighEcut and the BWsim model.
Current usage metrics show cumulative count of Article Views (full-text article views including HTML views, PDF and ePub downloads, according to the available data) and Abstracts Views on Vision4Press platform.
Data correspond to usage on the plateform after 2015. The current usage metrics is available 48-96 hours after online publication and is updated daily on week days.
Initial download of the metrics may take a while.