Free Access
Fig. 1.
Download original image
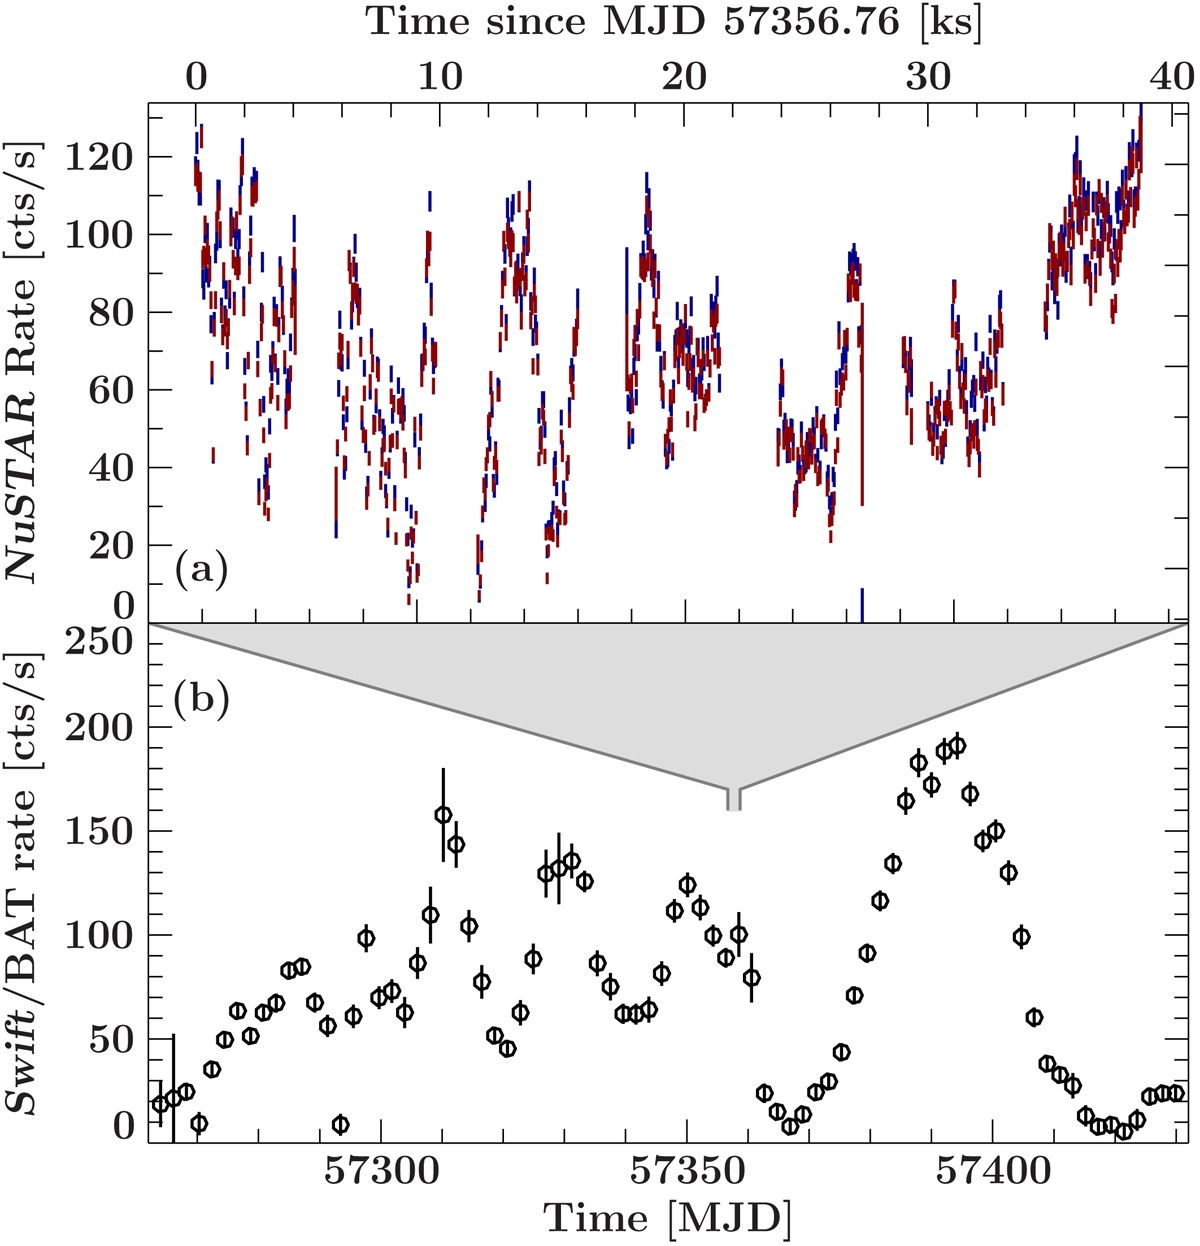
a: light curve of the observation as seen by NuSTAR. Red and blue data points show the NuSTAR light-curve corresponding to FPMA and FPMB. b: Swift/BAT (Krimm et al. 2013) light-curve of Cen X-3 around the observation time, binned to the orbital period of ∼2.08 d.
Current usage metrics show cumulative count of Article Views (full-text article views including HTML views, PDF and ePub downloads, according to the available data) and Abstracts Views on Vision4Press platform.
Data correspond to usage on the plateform after 2015. The current usage metrics is available 48-96 hours after online publication and is updated daily on week days.
Initial download of the metrics may take a while.