Fig. 6
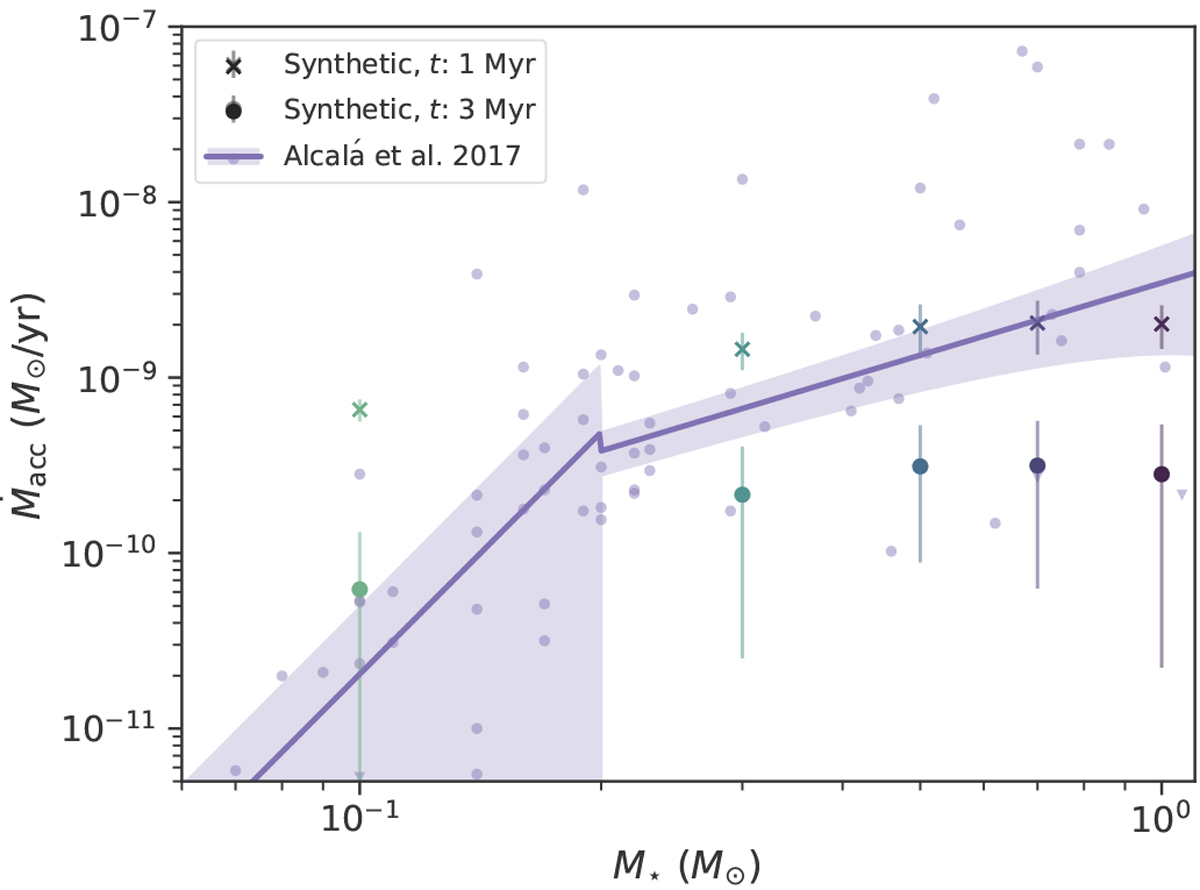
Download original image
Stellar accretion rates of observations and synthetic disk populations as a function of stellar mass. For the synthetic data points at two different times (colored crosses and large dots), the mean of the distribution is plotted and the standard deviation is indicated with error bars. The observational data (small points and triangles for upper limts) and the broken power-law fit with its estimated errors is taken from Alcalá et al. (2017) for the Lupus cluster (estimated age of 1–3 Myr). The break for this particular fit was chosen to lie at 0.2 M⊙ (motivated by Vorobyov & Basu 2009).
Current usage metrics show cumulative count of Article Views (full-text article views including HTML views, PDF and ePub downloads, according to the available data) and Abstracts Views on Vision4Press platform.
Data correspond to usage on the plateform after 2015. The current usage metrics is available 48-96 hours after online publication and is updated daily on week days.
Initial download of the metrics may take a while.