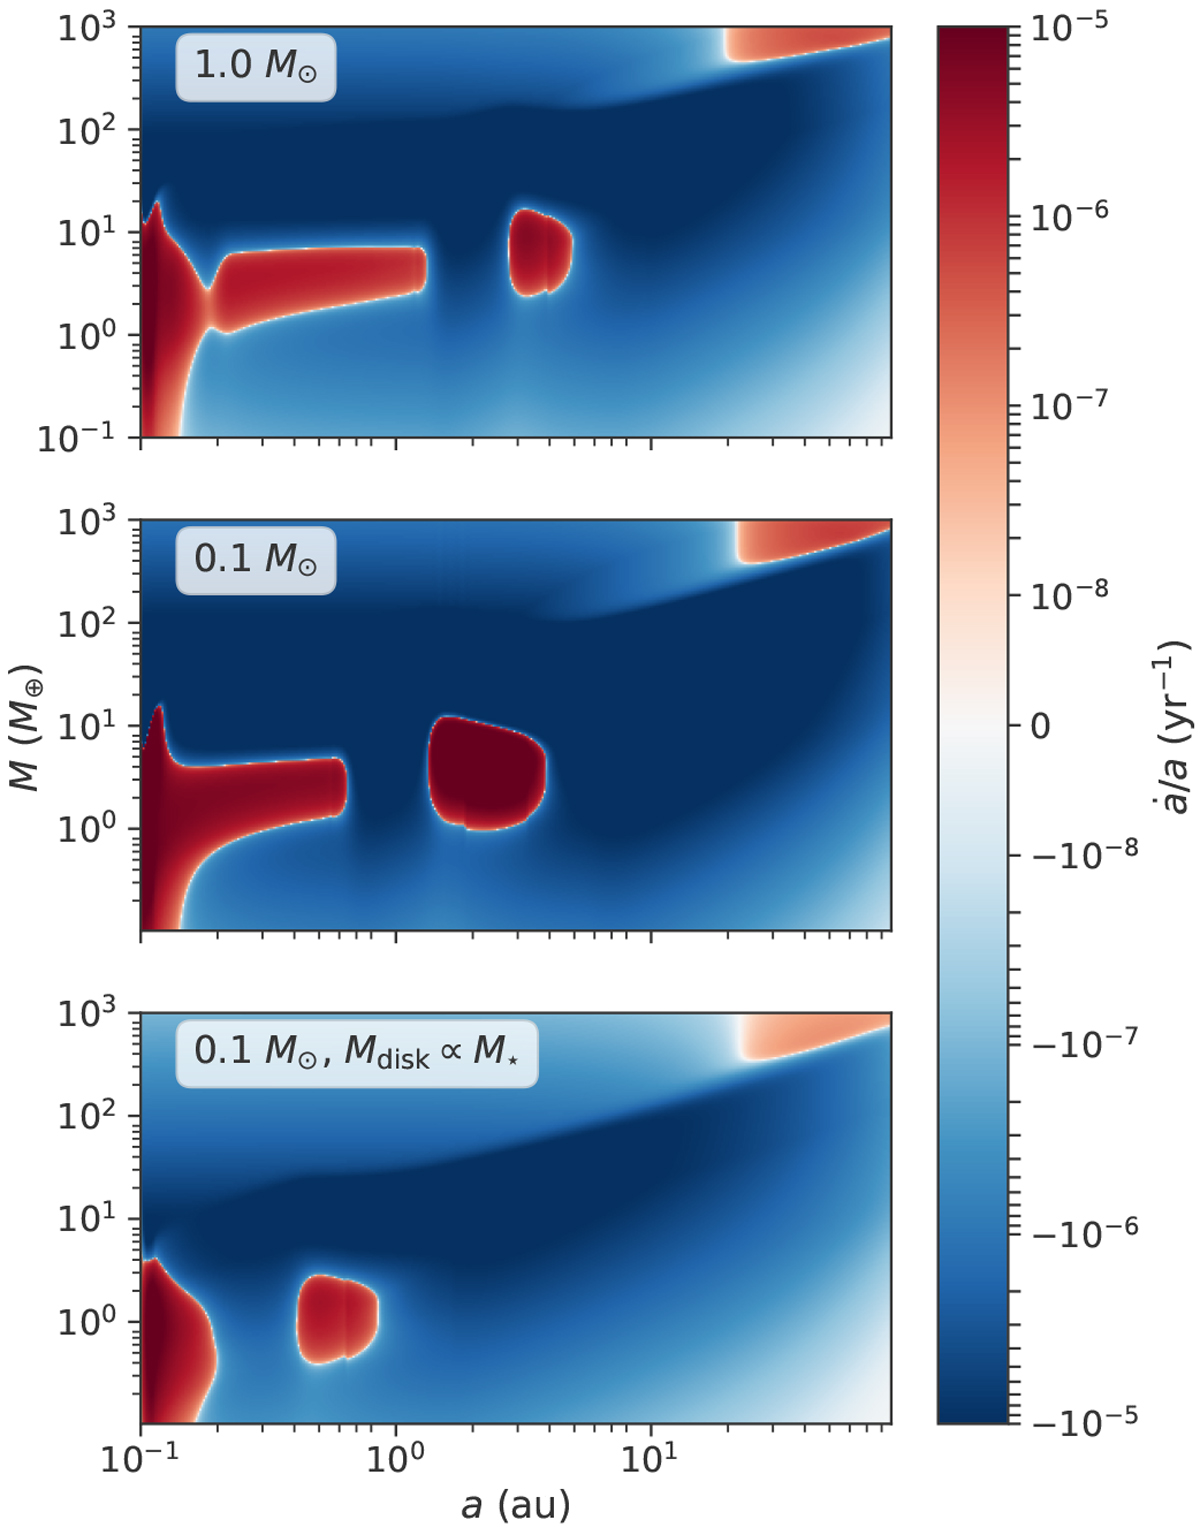
Fig. 1
Download original image
Normalized type I and type II migration rate for three different stellar masses and disks. In the top panel, a disk with a total mass of 0.02 M⊙ around a solar mass star after an evolution of 100 kyr is displayed; the central panel shows the same disk at the same time, but the stellar mass is reduced to 0.1 M⊙ ; and the normalized migration rates for a disk with ten times less mass around a 0.1 M⊙ star can be seen in the bottom panel. Regions with most strongest colors (blue or red) are regions where migration is fastest. With scaled disk mass, the outward migration zones (red) move to lower planet masses and closer orbits. This generally causes an earlier inward migration.
Current usage metrics show cumulative count of Article Views (full-text article views including HTML views, PDF and ePub downloads, according to the available data) and Abstracts Views on Vision4Press platform.
Data correspond to usage on the plateform after 2015. The current usage metrics is available 48-96 hours after online publication and is updated daily on week days.
Initial download of the metrics may take a while.