Fig. 7.
Download original image
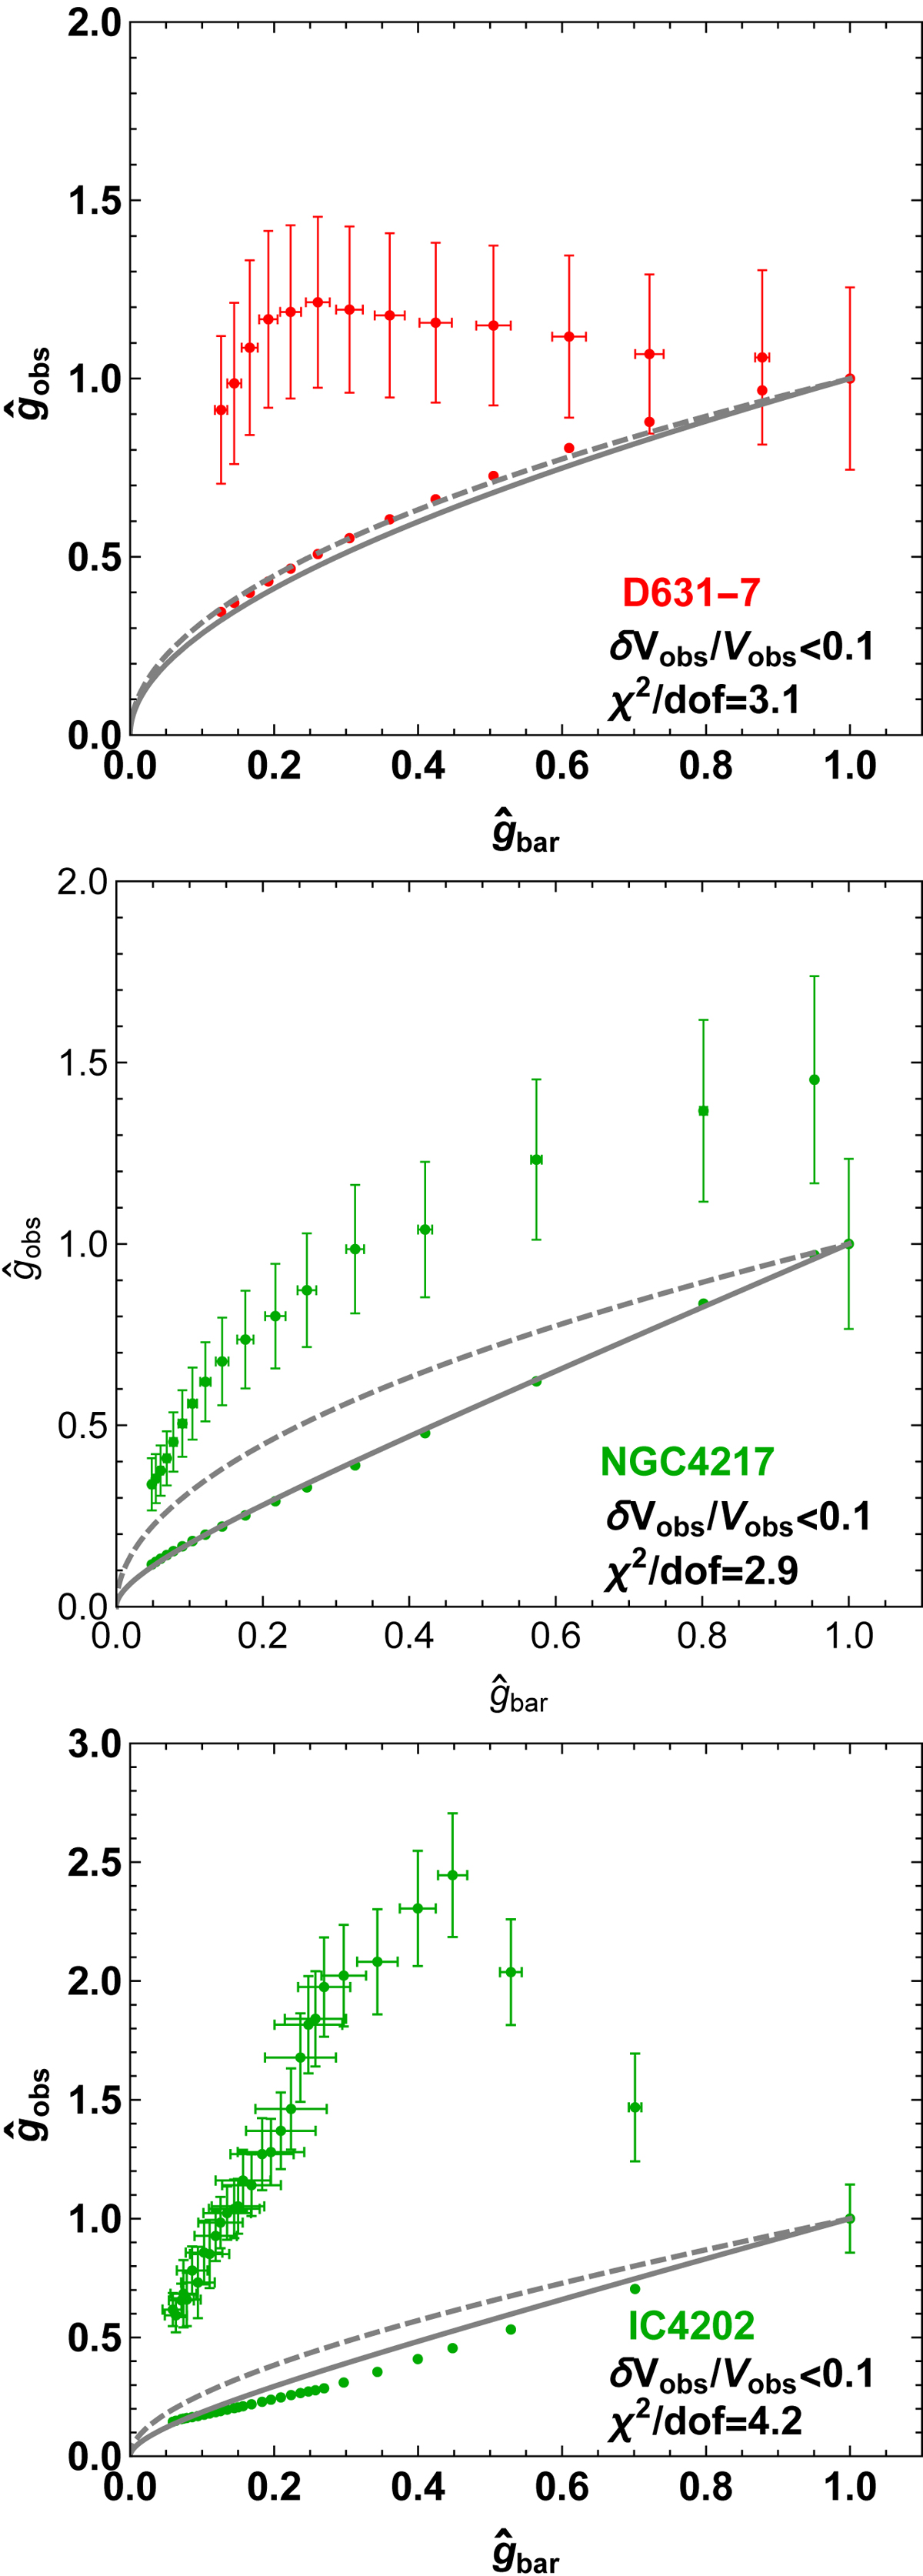
![]() -space data points (points with errors) of three of the cored SPARC galaxies shown in the left-hand panel of Fig. 4, compared to the MOND MI curve with g0 = 1.2 × 10⁻¹⁰ (solid grey), the MOND MI curve with the best-fit value of g0 for each galaxy (dashed grey), and MOND MG (Brada-Milgrom approximation) curves (points without errors). We note that most
-space data points (points with errors) of three of the cored SPARC galaxies shown in the left-hand panel of Fig. 4, compared to the MOND MI curve with g0 = 1.2 × 10⁻¹⁰ (solid grey), the MOND MI curve with the best-fit value of g0 for each galaxy (dashed grey), and MOND MG (Brada-Milgrom approximation) curves (points without errors). We note that most ![]() uncertainties are small for most cases because the ratios are constructed to reduce systematic uncertainties. Also shown are the χ2/d.o.f. values for the dashed best-fit MOND MI curves.
uncertainties are small for most cases because the ratios are constructed to reduce systematic uncertainties. Also shown are the χ2/d.o.f. values for the dashed best-fit MOND MI curves.
Current usage metrics show cumulative count of Article Views (full-text article views including HTML views, PDF and ePub downloads, according to the available data) and Abstracts Views on Vision4Press platform.
Data correspond to usage on the plateform after 2015. The current usage metrics is available 48-96 hours after online publication and is updated daily on week days.
Initial download of the metrics may take a while.