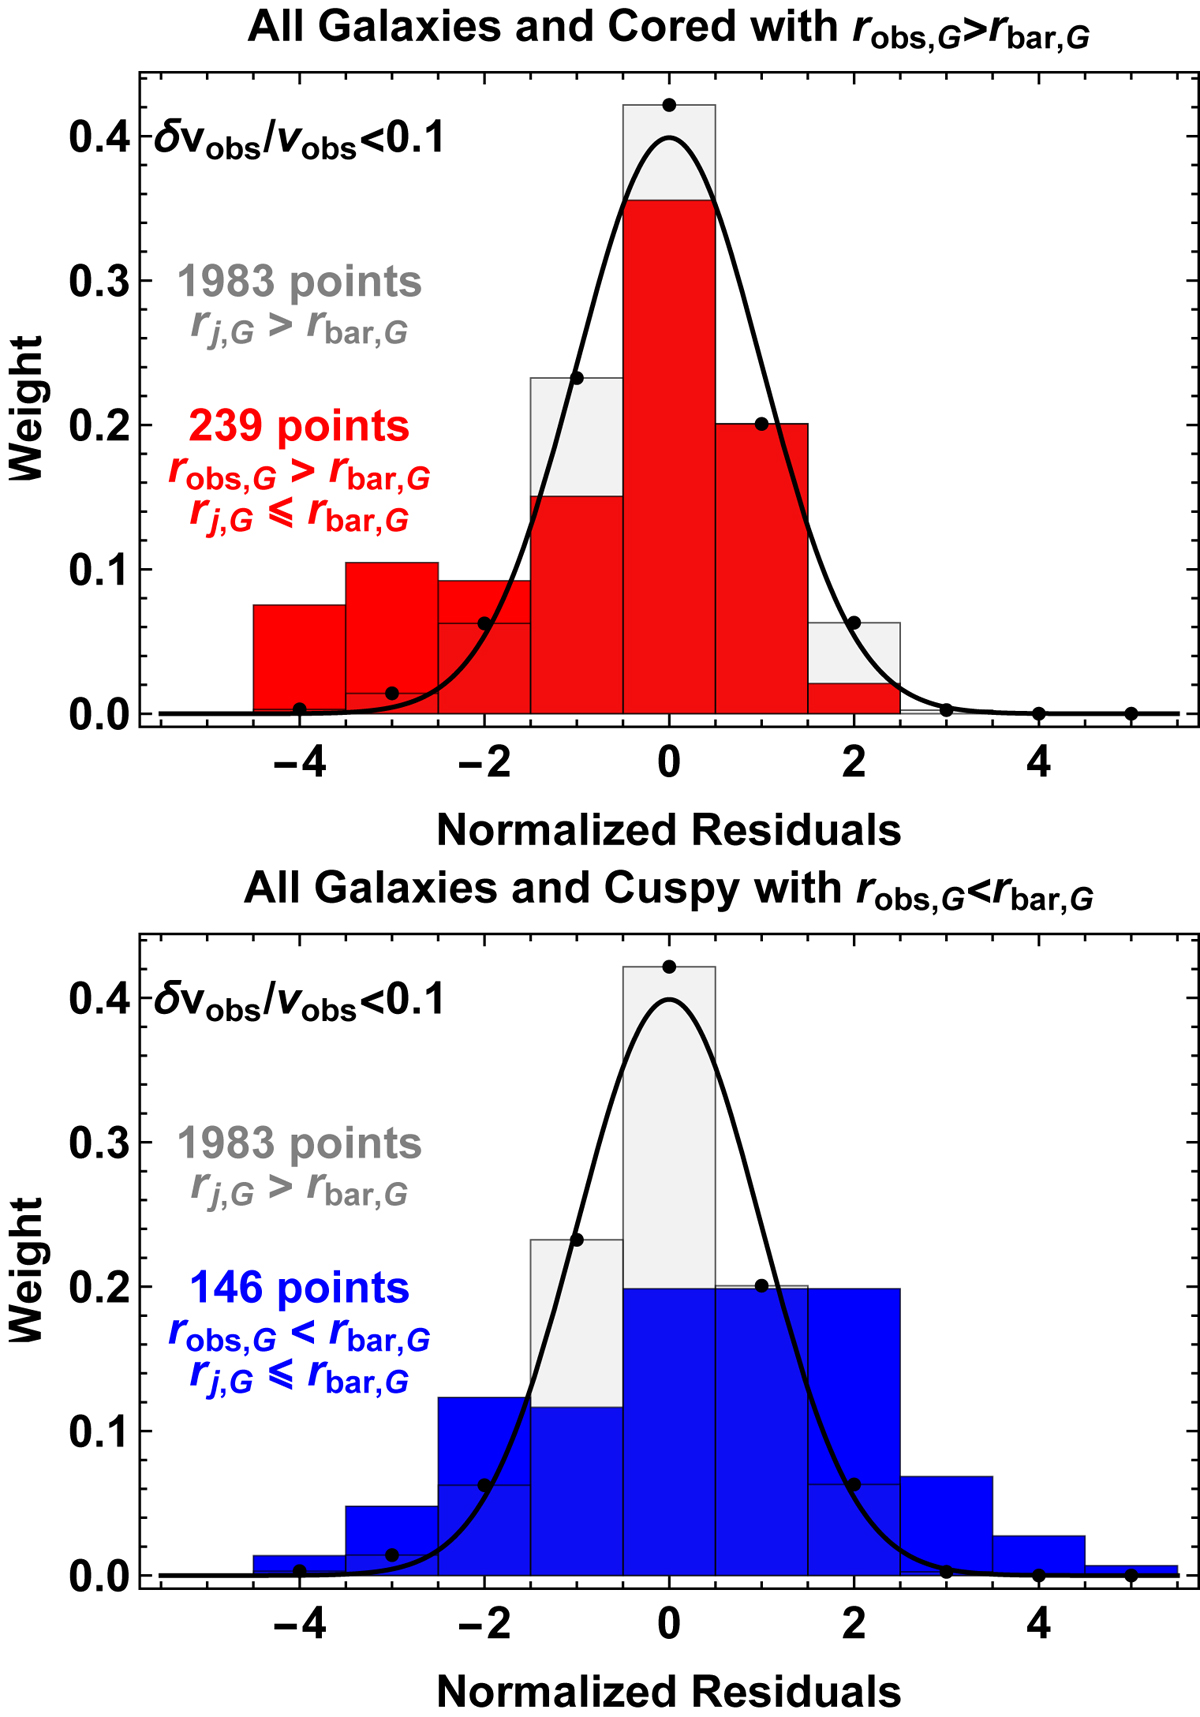
Fig. 5.
Download original image
Top panel: distribution of the normalized residuals R(rj, G) in Eq. (A.3) of SPARC data with respect to MOND MI with g0 = 1.2 × 10⁻¹⁰ m s−2. The grey histograms with black dots at each bin top shown on both panels are the 1983 SPARC data points at large radii, i.e., rj, G > rbar, G, after imposing the basic quality criteria and the δvobs/vobs < 0.1 cut employed in McGaugh et al. (2016), Lelli et al. (2017), and Lelli et al. (2016). Also shown in the top panel are normalized residuals of data points at small radii, rj, G ≤ rbar, G, from the (cored) galaxies only with robs, G > rbar, G (red histogram). Bottom panel: points at small radii, rj, G < rbar, G, from (cuspy) galaxies only with robs, G < rbar, G (cuspy; blue histogram).
Current usage metrics show cumulative count of Article Views (full-text article views including HTML views, PDF and ePub downloads, according to the available data) and Abstracts Views on Vision4Press platform.
Data correspond to usage on the plateform after 2015. The current usage metrics is available 48-96 hours after online publication and is updated daily on week days.
Initial download of the metrics may take a while.