Fig. 1.
Download original image
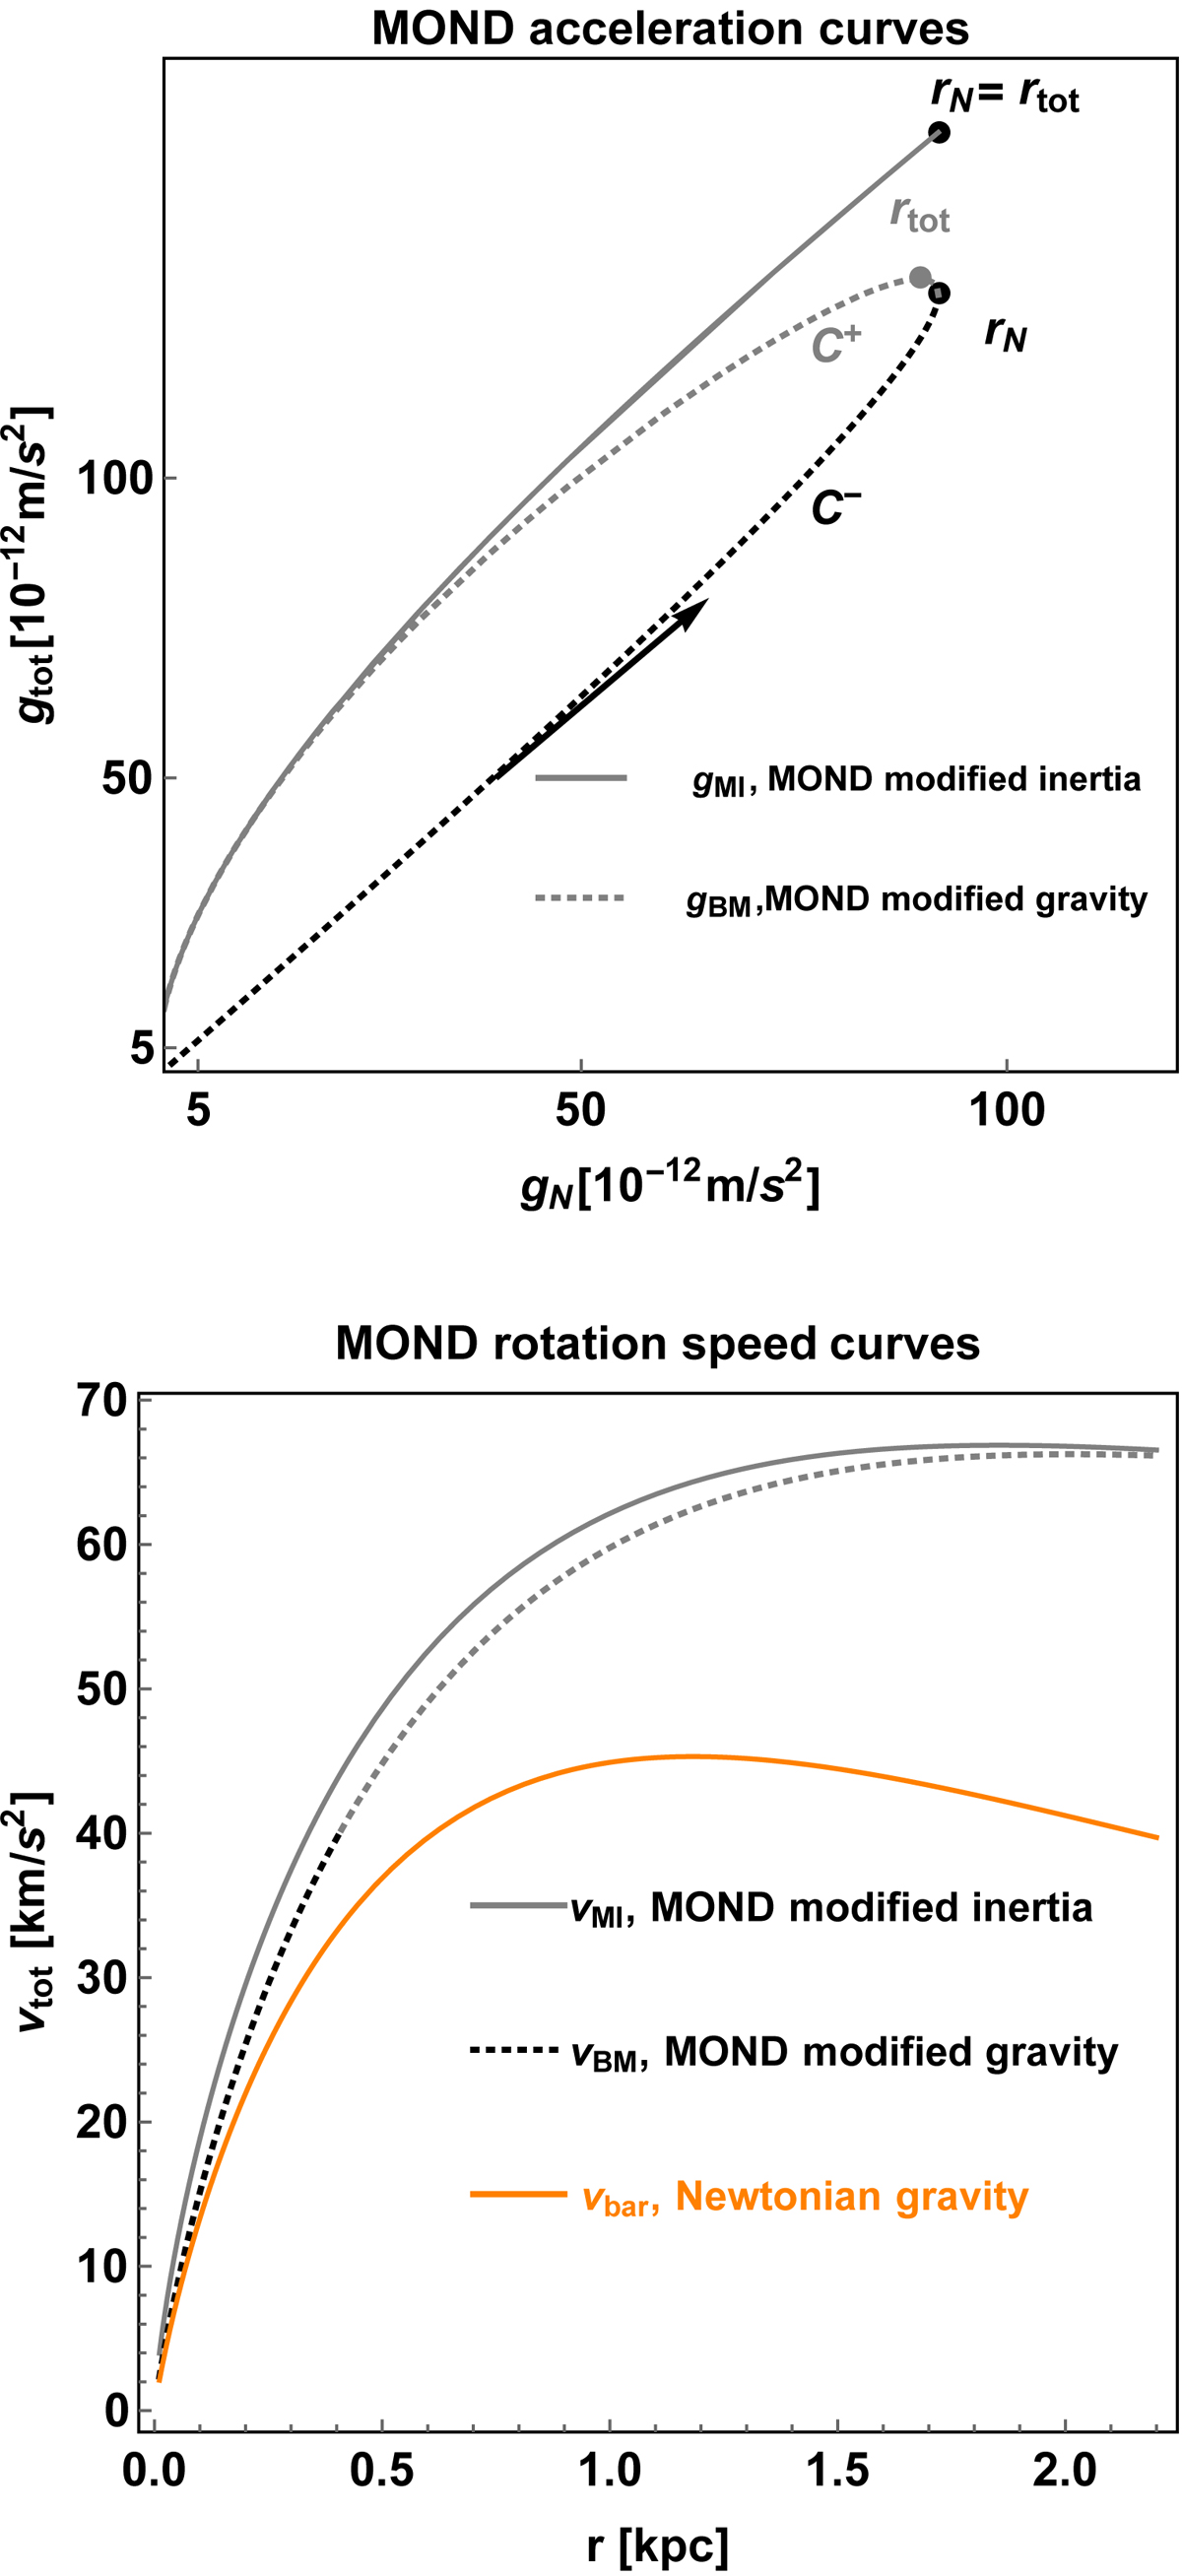
Top panel: centripetal acceleration curves in g2 space with the quantities rtot, rN, and 𝒞±, used for classification in Table 1, shown. The solid grey line shows a MOND MI curve with the radius of maximum baryonic acceleration and maximum total acceleration rN = rtot indicated. Also, the curve segments 𝒞+ and 𝒞− coincide, so the curve area is 𝒜(𝒞) = 0. The dotted grey and dotted black curves show the 𝒞± curve segments of a MOND MG curve, using the Brada-Milgrom approximation in Eq. (9), with rtot > rN and 𝒜(𝒞) > 0. For both, the baryonic matter is an infinitely thin exponential disc, Σ(r) = Σ0e−r/rd. The arrow indicates the direction of increasing radius along the curve. Bottom panel: corresponding rotation curves.
Current usage metrics show cumulative count of Article Views (full-text article views including HTML views, PDF and ePub downloads, according to the available data) and Abstracts Views on Vision4Press platform.
Data correspond to usage on the plateform after 2015. The current usage metrics is available 48-96 hours after online publication and is updated daily on week days.
Initial download of the metrics may take a while.